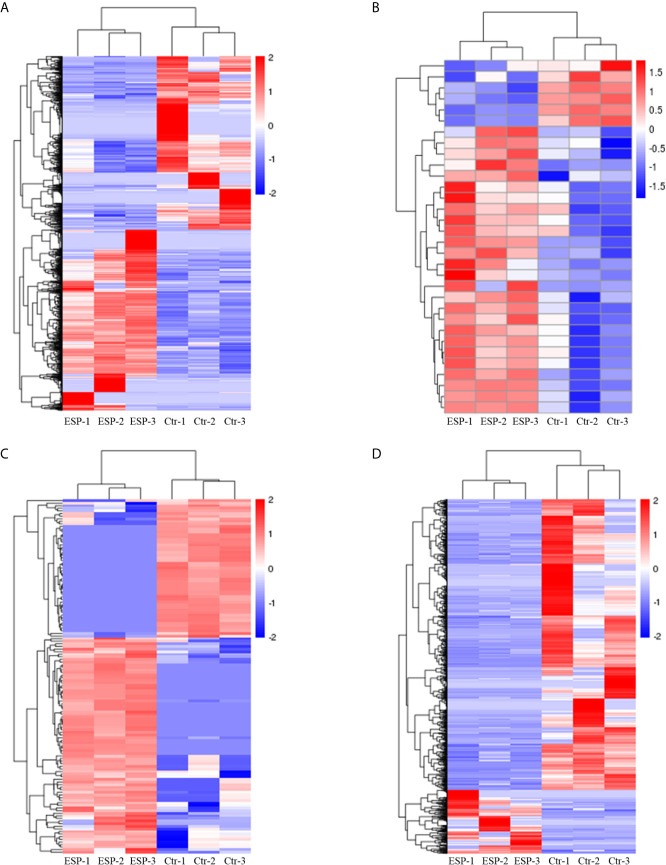
Figure 3.
Hierarchical clustering heatmaps of the differentially expressed genes mRNAs (A), miRNAs (B), circRNAs (C), and lncRNAs (D). Each column represents the value for one separate experiment of the control and ESP-treated goat PBMCs. Each raw represents the individual RNAs. The colors represent the level of expression of the RNAs in the sample with red and blue denoting higher and lower expression levels, respectively.

