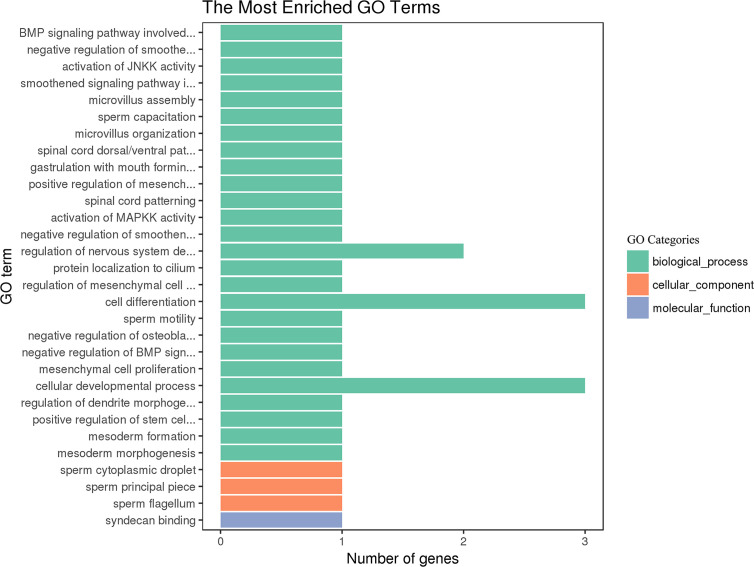
Figure 6.
GO enrichment of the differentially expressed miRNAs in goat PBMCs. The 30 most enriched GO terms in the biological process, cellular component and molecular function categories. The y-axis represents the significantly enriched GO terms and the x-axis shows the number of genes in each GO term.

