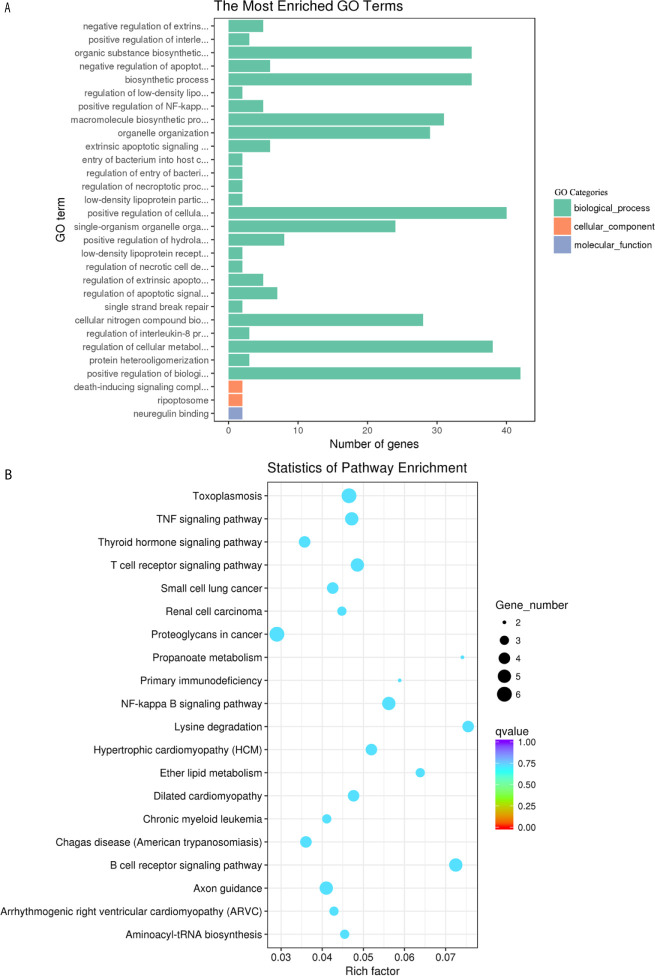
Figure 7.
GO enrichment and KEGG pathway analyses of target genes of the differentially expressed circRNAs in goat PBMCs. (A) The 30 most enriched GO terms in the biological process, cellular component and molecular function categories of target genes of differentially expressed circRNAs. (B) Scatterplot of KEGG pathway analysis of the top 20 predominant pathways. The x-axis denotes the pathway enrichment. The y-axis represents the names of the significantly enriched pathways. The P-values are indicated by variations from blue to red. A deeper blue color indicates a greater significant difference.

