FIGURE 3.
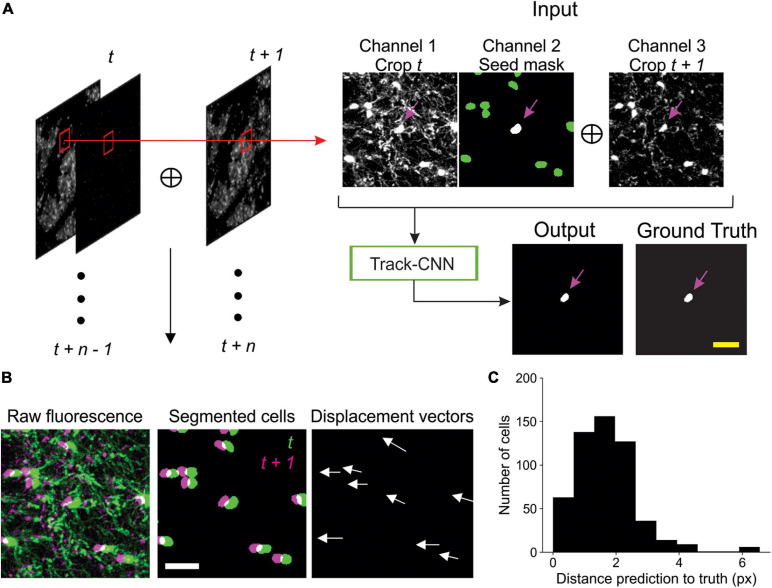
Track-CNN processing steps. (A) Crops are taken from each pair of timepoints t and t + 1 centered around a cell denoted by magenta arrow on channel 1. Channel 1 contains raw fluorescence from timepoint t. Channel 2 contains seed mask of cell of interest (magenta arrow). Adjacent segmented cells are set to a lower value (green). Channel 3 contains raw fluorescence from timepoint t + 1. Cropped images are concatenated together to form input to network. The network output is a semantic segmentation indicating the location of the seed masked cell on timepoint t + 1. This procedure is repeated for all cells on all consecutive timepoints. Scale bar: 30 μm. (B) Example showing local coherence in how tracked cells in a local region shift between timepoint t (green) and t + 1 (magenta), allowing for predictive post-processing using displacement vectors of each tracked cell from timepoint t to t + 1 (white arrows). Scale bar: 30 μm. (C) Distribution of distances from predicted to actual location of cell on timepoint t + 1 given any cell on timepoint t. The prediction is generated by taking the average displacement vector of five nearest neighbor tracks. Differences between predicted and actual location were typically within six pixels.

