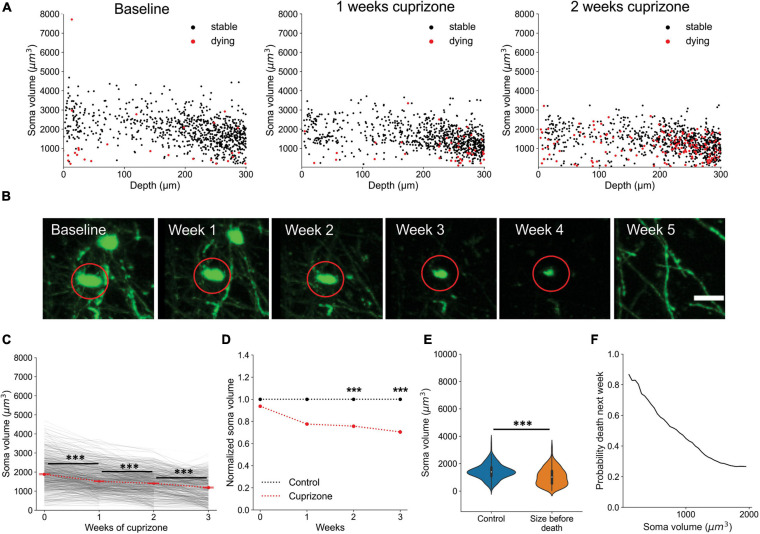
FIGURE 8.
Oligodendrocyte death can be predicted from cell soma volume. (A) Volume of cell somata within 1 week of dying (red) at baseline, 1 week cuprizone, and 2 week cuprizone timepoints. (B) Representative example of cell soma shrinkage throughout cuprizone treatment, resulting in eventual death. Scale bar: 20 μm. (C) Plot of soma volume decrease for 860 cells during cuprizone treatment. (D) Plot of average soma volume of dying cells at each timepoint of cuprizone treatment relative to timepoint matched cells from control mice. All values are normalized to the mean soma volume of stable control cells at each matched timepoint. (E) Overall distribution of soma volumes for non-treated cells and cells within 1 week of death during cuprizone treatment. (F) Probability that a cell soma below a certain volume is within 1 week of death. Cells pooled from n = 4 cuprizone treated and n = 3 control mice. See Supplementary Table 1 for statistical tests and significance level for each comparison. ***p < 0.001.

