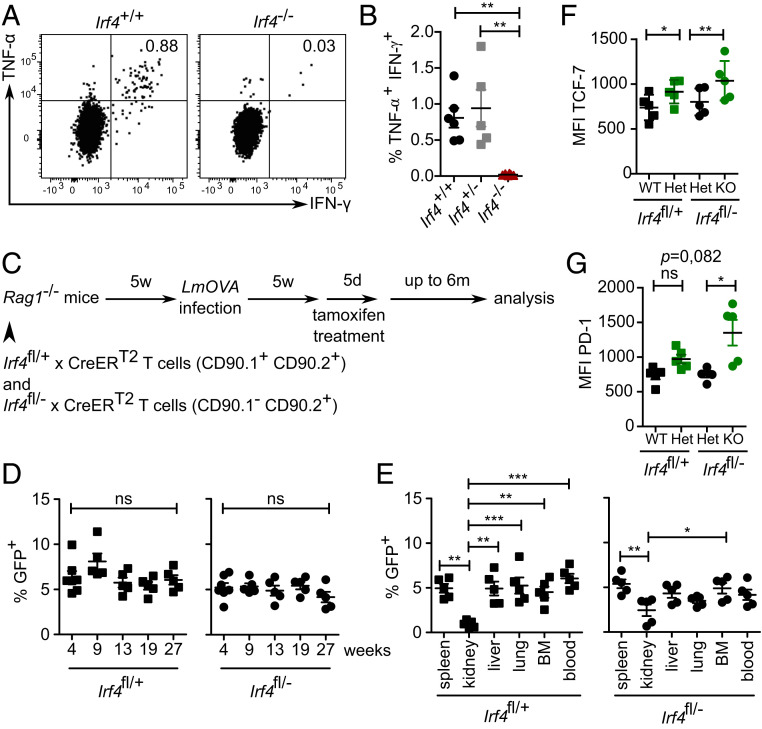
Fig. 2.
Survival of CD8+ T cells in the absence of IRF4. (A and B) Mice were infected with LmOVA. After 5 wk, spleen cells were stimulated with OVA257–261 peptide for 4 h, and the production of IFN-γ and TNF-α in CD8+ T cells was determined by FACS. (A) Representative dot plots for CD8-gated cells and (B) %-values for CD8+ T cells from Irf4+/+, Irf4+/− and Irf4−/− mice. Pooled results from two independent experiments with five or six mice/group. Mean ±SEM, ANOVA, and Bonferroni’s post-test. (C–G) Rag1−/− mice were reconstituted with T cells from naïve Irf4fl/+×CreERT2 and Irf4fl/−×CreERT2 mice. Recipient mice were infected with LmOVA. After 5 wk, mice were treated with tamoxifen for 5 d. Mice were analyzed at the indicated time points. (For the gating strategy see SI Appendix, Fig. S2A). (D) Percentage of GFP+ Irf4fl/+ and Irf4fl/− CD44+ CD8+ T cells in blood at the indicated weeks after tamoxifen treatment. (E) Percentage of GFP+ cells of CD44+ CD8+ T cells in different tissues of recipients 6 mo after tamoxifen treatment. (D and E) Representative result of two independent experiments with five or six mice/experiment. Mean ± SEM, ANOVA, and Bonferroni’s post-test. (F and G) Mean fluorescence intensity of TCF-7 and PD-1 expression of GFP+ and GFP− CD8+ T cells from Irf4fl/+×CreERT2 and Irf4fl/−×CreERT2 donors 6 mo after tamoxifen treatment. Representative result of two independent experiments with five or six mice/experiment). Mean ± SEM, paired t test. *P ≤ 0.05, **P ≤ 0.01, ***P ≤ 0.001.

