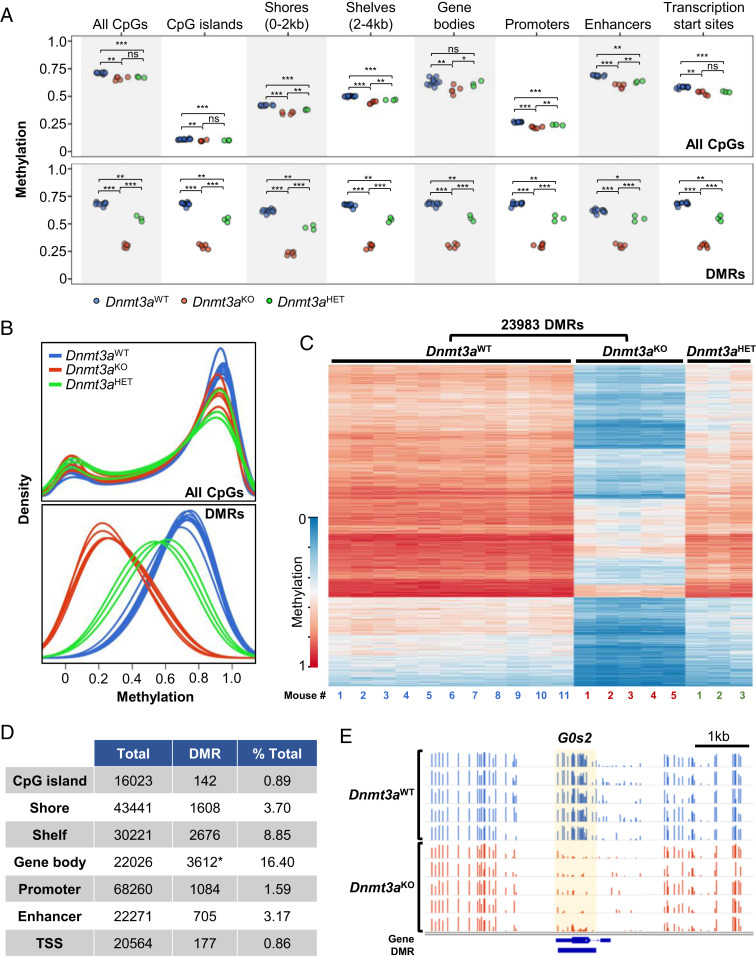
Fig. 1.
Dnmt3a deficiency results in focal, canonical CpG methylation loss in murine epidermal cells. (A) WGBS of isolated murine epidermal cells, comparing independent samples from 11 Dnmt3aWT vs. 5 Dnmt3aKO vs. 3 Dnmt3aHET mice. Dot plots represent average methylation values over annotated regions for all CpGs (Top) and for DMRs within each annotated region (Bottom). Significance was determined by Student’s t test with denotation of “ns” for not significant and levels of significance as * adjusted P < 0.05, **P < 0.01, ***P < 0.001. (B) Methylation density plots for the indicated genotypes across all genomic CpGs (Top) and at DMRs (Bottom). (C) Targeted deficiency of Dnmt3a (Krt14-Cre+ × Dnmt3afl/fl, Dnmt3aKO) results in 23,983 DMRs in epidermal cells compared to wild-type control, Dnmt3aWT. Heatmap representation of WGBS data demonstrates DMRs defined by differences between Dnmt3aWT vs. Dnmt3aKO epidermal cells. Heterozygosity for Dnmt3a (Krt14-Cre+ × Dnmt3afl/+, Dnmt3aHET) results in an intermediate phenotype. Each column represents an independent mouse. (D) Annotated regions associated with DMRs. *Of 16,315 DMRs involving gene bodies, 3,612 unique genes are involved. (E) Integrated genome viewer (IGV) view of the G0s2 gene CpG methylation of Dnmt3aWT versus Dnmt3aKO epidermal cells. Normalized methylated CpG reads are represented in bars (scale 0 to 1.0 for each row). Differentially methylated regions are indicated in the bottom track and highlighted in yellow.

