Fig. 2.
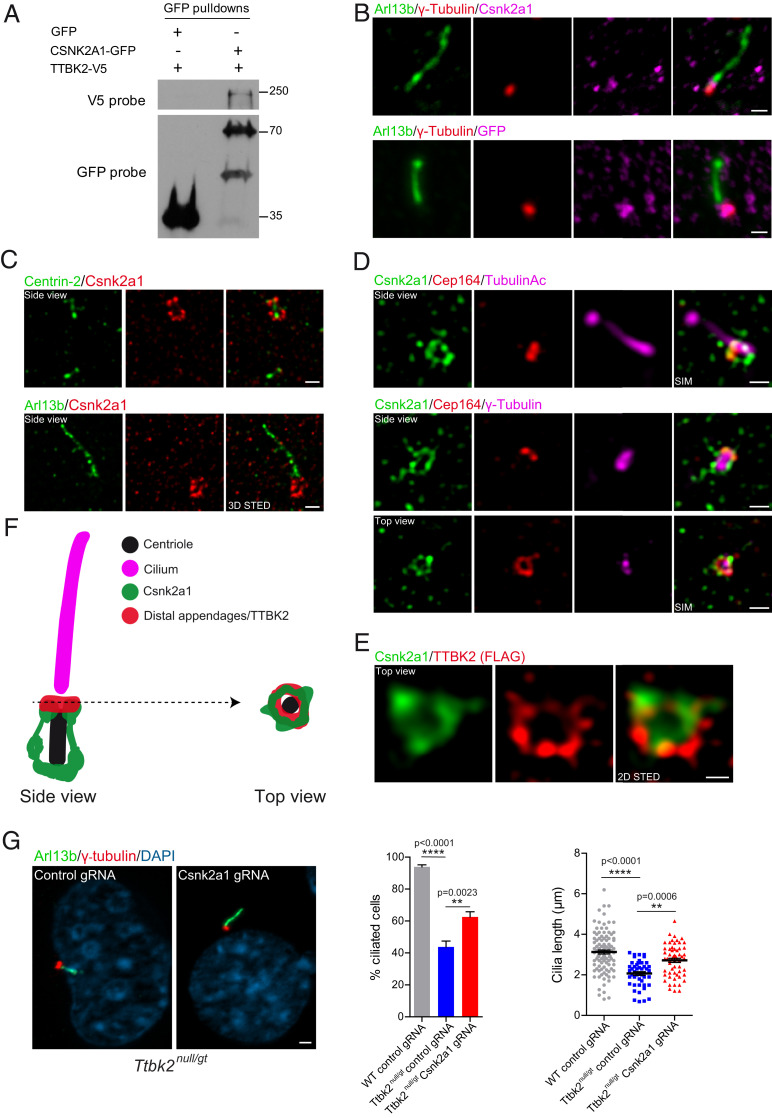
CSNK2A1 is a centrosomal protein that opposes TTBK2 function. (A) TTBK2-V5 was overexpressed with GFP or CSNK2A1-GFP in HEK293T cells. GFP pulldowns were performed on total cell lysates, and Western blots were probed with antibodies to V5 and GFP tags. (B) Endogenous (Upper) and GFP-tagged (Lower, stably expressed, both magenta) CSNK2A1, costained with the centrosomal protein γ-tubulin (red) and ciliary marker ARL13B (green) in WT MEFs. (Scale bars, 1 μm.) (C) 3D STED superresolution images show the endogenous CSNK2A1 (red) surrounding the centriole core (Centrin-2 green, Upper). Lower shows CSNK2A1 signal at the vicinity of the cilium. (Scale bars, 500 nm.) (D) SIM acquisitions show that CSNK2A1 exhibits a complex basal body-associated organization. (Upper) A side view of CSNK2A1 (green) at the base of the cilium labeled with acetylated alpha-tubulin (magenta) and partially overlapping with CEP164 (red). (Lower) CSNK2A1 tightly surrounds the pericentriolar material, labeled by γ-tubulin (magenta), partially overlapping with CEP164 (Upper and Lower). (Scale bars, 500 nm.) (E) Representative two-dimensional STED images from WT MEFs, exhibiting the top view of CSNK2A1 (green), in a ring-shaped structure and colocalizing with TTBK2 (red). (Scale bar, 250 nm.) (F) Cartoon illustrating the subcellular organization of CSNK2A1 at the basal body. (G) Cilia defects in Ttbk2null/gt cells are partially rescued by Csnk2a1 knockout. Representative immunofluorescence images from cells labeled with ARL13B (Green) and γ-tubulin (red). DNA was stained with DAPI. (Scale bar, 2 μm.) Graphs show the mean percentage of ciliated cells (left graph: WT control guide RNA (gRNA) n = 105; Ttbk2null/gt control gRNA n = 251; and Ttbk2null/gt Csnk2a1 gRNA n = 282 cells) and cilia length (right graph: WT control gRNA n = 105; Ttbk2null/gt control gRNA n = 48; and Ttbk2null/gt Csnk2a1 gRNA n = 58 cells). Error bars denote the SEM. Statistical comparison was performed by one-way ANOVA with Tukey’s multiple comparisons test. P values are shown on the graph.

