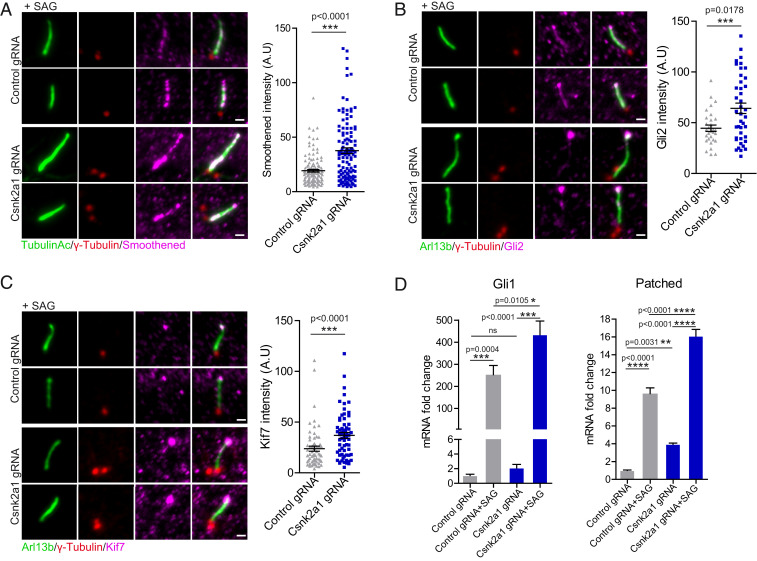
Fig. 4.
CSNK2A1-mutant cilia exhibit increased SHH response. (A) SMO accumulates in Csnk2a1-mutant cilia. Representative immunofluorescence images stained for acetylated tubulin (green), γ-tubulin (red), and SMO (magenta), from control and Csnk2a1 KO-1 cells. The graph shows the mean intensity of SMO ± SEM along the cilium in control and Csnk2a1 KO-1 cells. Statistical comparison was performed using the nonparametric Mann–Whitney U test. P value is displayed on the graph. Data collected from control gRNA n = 123, Csnk2a1 gRNA n = 120 cilia. (Scale bars, 1 μm.) (B) Csnk2a1-mutant cilia exhibit higher levels of GLI2 at the tip. Representative immunofluorescence images labeled with antibodies to ARL13B (green), γ-tubulin (red), and GLI2 (magenta), from control and Csnk2a1 KO-1 cells. Graph shows the mean intensity of GLI2 ± SEM at the ciliary tip in control and Csnk2a1 KO-1 cells. Statistical comparison was performed using the nonparametric Mann–Whitney U test. P value is displayed on the graph. Data points collected from control gRNA n = 30 cilia, Csnk2a1 gRNA n = 41 cilia. (Scale bars, 1 μm.) (C) Csnk2a1-mutant cilia show increased levels of KIF7 at the ciliary tip. Representative immunofluorescence images of cilia labeled with antibodies to ARL13B (green), γ-tubulin (red), and KIF7 (magenta), from control and Csnk2a1 KO-1 cells. Graph shows the mean intensity of KIF7 ± SEM. Statistical comparison was performed using the nonparametric Mann–Whitney U test. P value is shown on the graph. Examined data points were collected from control gRNA n = 63 cilia, Csnk2a1 gRNA n = 64 cilia. (Scale bars, 1 μm.) (D) Real-time qPCR shows a significant increase in messenger RNA (mRNA) fold change (relative to untreated control) ± SEM of Gli1 and patched transcripts in Csnk2a1 KO-2 cells. Graphs were produced from three replicates per condition from two independent experiments. Statistical comparison was performed by two-way analysis ANOVA with Tukey’s multiple comparisons test. P values are shown on the graph (ns, not significant).

