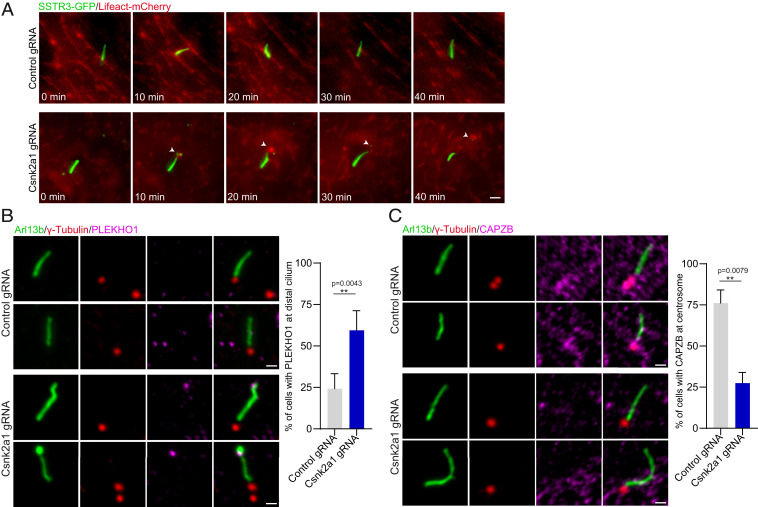
Fig. 6.
Actin and actin modifiers are perturbed in Csnk2a1-mutant cilia. (A) F-actin transiently localizes to mutant cilia prior to cilia excision. SSTR3-GFP and Lifeact-mCherry were overexpressed in control and Csnk2a1 KO-1 cell lines. Time-lapse imaging was performed on ciliated cells every 10 min for 40 min. (Scale bars, 2 μm.) (B) PLEKHO1 abnormally localizes to the distal domain of Csnk2a1-mutant cilia. Representative immunofluorescence images labeled with ARL13B (green), γ-tubulin (red), and PLEKHO1 (magenta). Graphs show the mean percentage of cells with PLEKHO1 at distal cilium in control and Csnk2a1 KO-1 cells. Statistical comparison was performed using the nonparametric Mann–Whitney U test. P values are shown on the graph. Cell number details: control gRNA n = 37 and Csnk2a1 gRNA n = 65 cells. (Scale bars, 1 μm.) (C) CAPZB centrosomal localization is disrupted in Csnk2a1-knockout cilia. Representative immunofluorescence images labeled ARL13B (green), γ-tubulin (red), and CAPZB (magenta). Graphs show the mean percentage of cells with CAPZB at the centrosome in control and Csnk2a1 KO-1 cells. Statistical comparison was performed using the nonparametric Mann–Whitney U test. P values are shown on the graph. Cell number details: control gRNA n = 37 and Csnk2a1 gRNA n = 65 cells. (Scale bars, 1 μm.)

