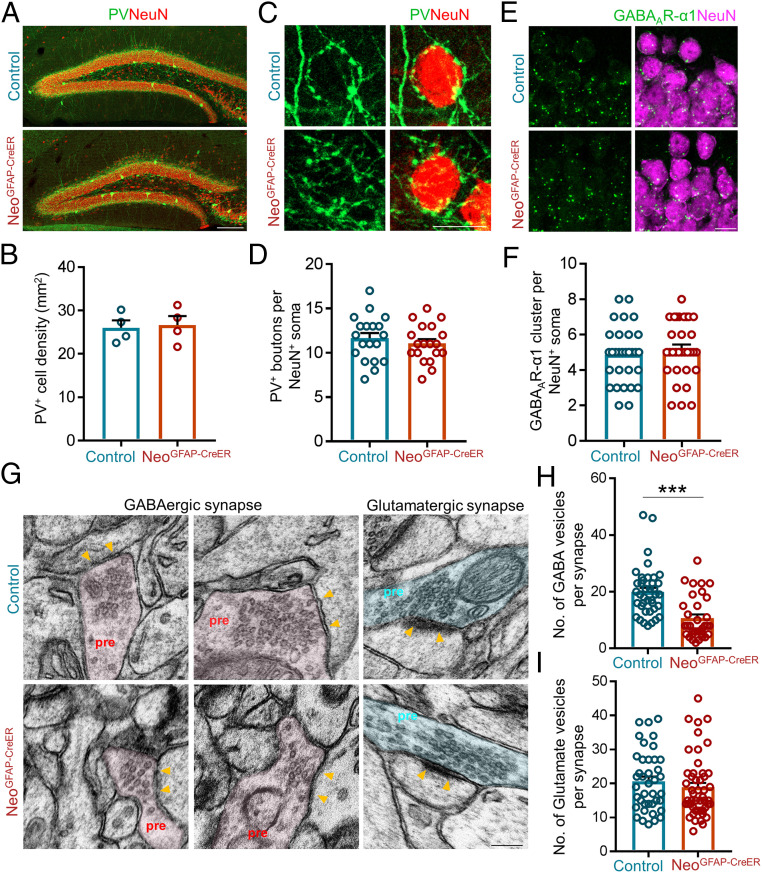
Fig. 4.
Reduced GABAergic, but not glutamatergic, vesicles in DG neurons of astrocytic Neo1 KO mice. (A) Coimmunostaining of PV (green) and NeuN (red) in DG of control and NeoGFAP-CreER mice. (Scale bar, 100 μm.) (B) Quantification of the data in (A), the density of PV+ interneurons in DG. n = 4 mice for each genotype. Student’s t test. (C) Coimmunostaining of PV+ (green) presynaptic terminals and NeuN (red) in DG of control and NeoGFAP-CreER mice. (Scale bar, 10 μm.) (D) Quantification of the data in (C), the number of PV+ boutons surrounding the NeuN+ soma. n = 19 neurons, 3 mice for each genotype. Student’s t test. (E) Coimmunostaining of NeuN (green) and GABAAR-α1 (red) in DG of control and NeoGFAP-CreER mice. DAPI staining indicates cell nucleus. (Scale bar, 10 μm.) (F) Quantification of the data in E, the number of GABAAR-α1+ cluster per NeuN+ soma. n = 32 neurons, 3 mice for each genotype. Student’s t test. (G) Representative EM images of GABAergic and glutamatergic synapses in control and NeoGFAP-CreER mice. Yellow arrows indicate the postsynaptic areas. (H and I) Quantification of data in G, the number of GABAergic vesicles per synapse (H) and the number of glutamatergic vesicles per synapse (I). n = 39 synapses for control group and n = 34 synapses for NeoGFAP-CreER group in H; n = 40 synapses for control group and n = 49 synapses for NeoGFAP-CreER group in I. Student’s t test. Data in B, D, F, H, and I are presented as the mean ± SEM.

