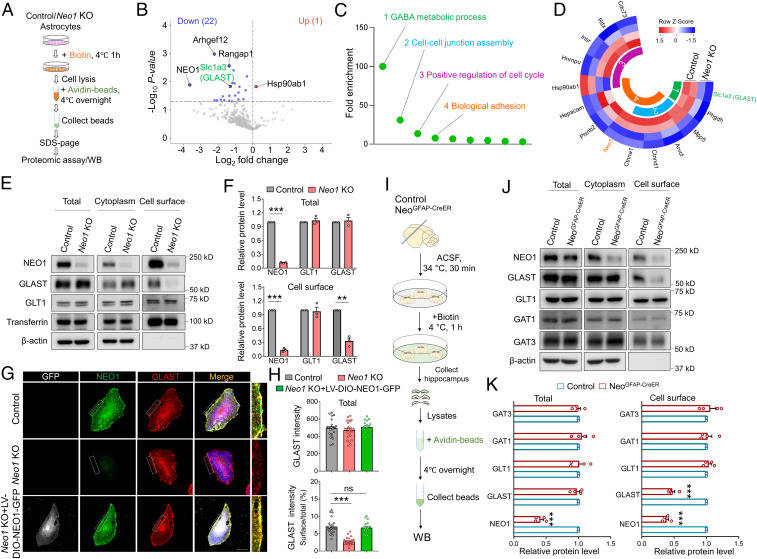
Fig. 5.
Decreased GLAST cell surface level in Neo1 KO astrocytes and hippocampus of NeoGFAP-CreER mice. (A) Schematic diagram of quantitative proteomic analysis. Proteomic data were obtained from surface proteins of control and Neo1 KO astrocytes. (B) Volcano plots of differentially expressed proteins in the cell surface of control and Neo1 KO astrocytes. (C) GO enrichment analysis of dysregulated proteins in biological processes. (D) Heat map of selected differentially expressed proteins in the first four biological processes of C. (E) Western blot analyses of lysates of total and cell surface fractions of control and Neo1 KO astrocytes. (F) Quantification of the data in E, the relative band intensity of total (up) and cell surface (down) NEO1, GLT1, and GLAST. n = 3 for each group. Student’s t test. (G) Coimmunostaining of GFP (white), NEO1 (green), GLAST (red), and GFAP (blue) in cultured control, Neo1 KO and Neo1 KO+LV-DIO-NEO1-GFP astrocytes. (Scale bar, 20 μm.) (H) Quantification of the data in G, the fluorescent intensity of total GLAST (up) and the ratio of cell surface GLAST over total GLAST (down). n = 23 cells for control group; n = 24 cells for Neo1 KO group; n = 17 cells for Neo1 KO+LV-DIO-NEO1-GFP group. One-way ANOVA test, F(2, 61) = 81.06, P < 0.0001. (I) Schematic diagram of biotinylation of cell surface proteins in hippocampus of control and NeoGFAP-CreER mice. (J) Western blot analyses of homogenates of total and cell surface fractions of control and NeoGFAP-CreER hippocampus. (K) Quantification of the data in J, the relative band intensity of total (Left) and cell surface (Right) NEO1, GLT1, GLAST, GAT1, and GAT3. n = 4 for each group. Student’s t test. Data in F, H, and K are presented as the mean ± SEM. **P < 0.01; ***P < 0.001.

