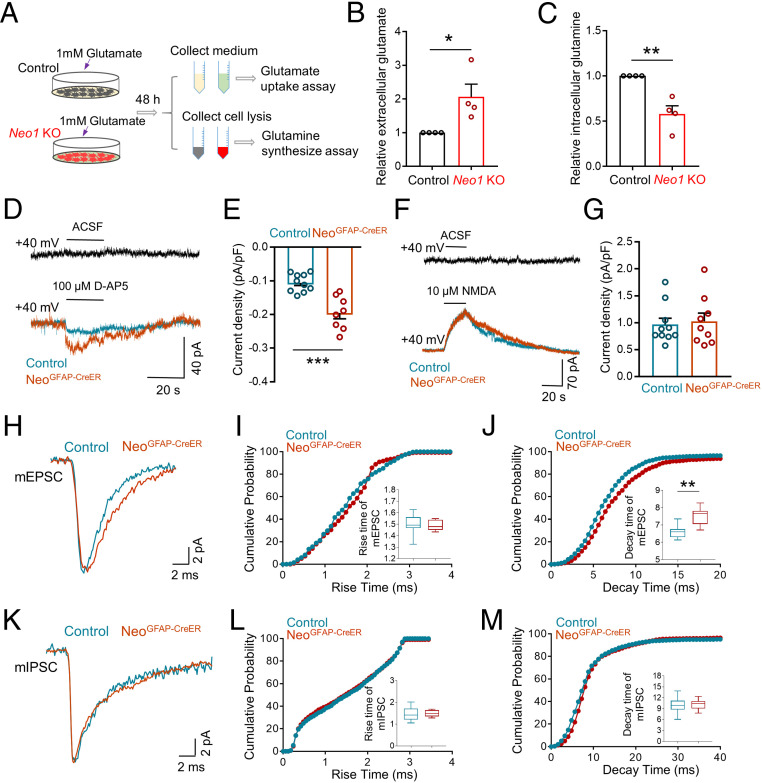
Fig. 6.
Impaired glutamate uptake and glutamine synthesis, accompanied with increased extracellular glutamate levels, by depleting astrocytic Neo1. (A) Schematic diagram of glutamate uptake assay and glutamine synthesis assay in control and Neo1 KO astrocytes. (B and C) Quantification of the data in A, the relative extracellular glutamate (B) and intracellular glutamine level (C). Values of control astrocytes were taken as 1. n = 4 for each group. Student’s t test. (D) Representative traces of DG neurons after adding 100 µM D-AP5 in control and NeoGFAP-CreER brain slices. ACSF: Artificial cerebrospinal fluid. (E) Quantification of the data in D, the current density elicited by 100 µM D-AP5. n = 10 neurons, 3 mice for control group; n = 8 neurons, 3 mice for NeoGFAP-CreER group. Student’s t test. (F) Representative traces of DG neurons after adding 10 µM NMDA in control and NeoGFAP-CreER brain slices. ACSF: Artificial cerebrospinal fluid. (G) Quantification of the data in F, the current density evoked by 10 µM NMDA. n = 10 neurons, 3 mice for control group; n = 9 neurons, 3 mice for NeoGFAP-CreER group. Student’s t test. (H) Representative trace of a single mEPSC in DG neurons of control and NeoGFAP-CreER mice after tamoxifen treatment. (I and J) Quantification of the data in H, the rise time (I) and decay time (J) of mEPSC. n = 8 neurons, 3 mice for each genotype. Student’s t test. (K) Representative trace of a single mIPSC in DG neurons of control and NeoGFAP-CreER mice after tamoxifen treatment. (L and M) Quantification of the data in K, the rise time (L) and decay time (M) of mIPSC. n = 8 neurons, 3 mice for control group; n = 10 neurons, 3 mice for NeoGFAP-CreER group. Student’s t test. Data in B, C, E, and G are presented as the mean ± SEM; data in I, J, L, and M are presented as median with interquartile range; whiskers are the minimum and maximum. *P < 0.05, **P < 0.01, ***P < 0.001.

