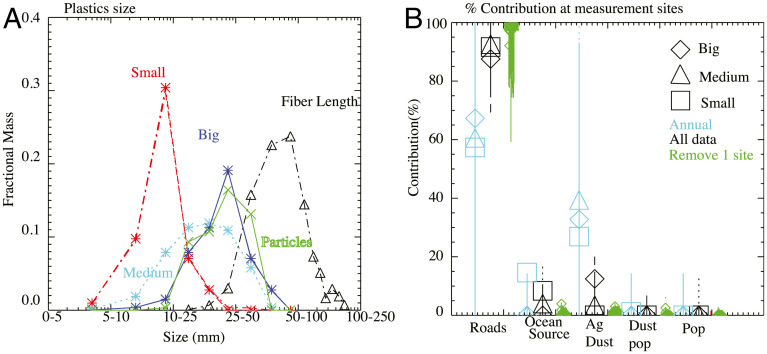
Fig. 2.
(A) The fractional mass by size of the particles (green x’s) and fibers in the observations (black triangles). In the model, the particles are assumed to be transported as observed, but because the fibers are mostly 1 µm in diameter but much longer, the aerodynamic size that is appropriate is not well established and thus are simulated in three sizes: small (red), medium (cyan), and big (dark blue), with medium being the base case. (B) Estimates of the contribution at the observing sites from different sources as inferred using the method described in Materials and Methods for the three sizes: big (diamond), medium (triangle), and small (square). For all sources and cases, the 95% confidence limits are shown as vertical lines. Multiple sensitivity studies were conducted (see Materials and Methods for details) with time averaging (cyan) and with each site withheld (green), showing the ranges of values that can be obtained for each relative source strength.

