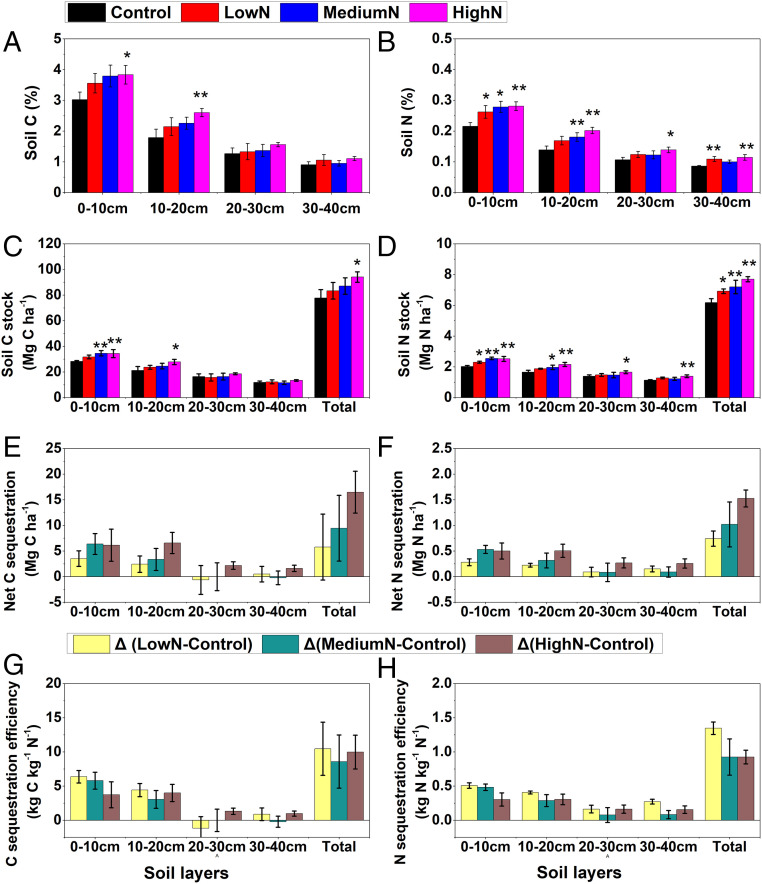
Fig. 1.
Effects of long-term N addition on soil C and N at 0- to 40-cm soil layers in the N-saturated tropical forest of South China. (A) Soil C concentrations. (B) Soil N concentrations. (C) Soil C stocks. (D) Soil N stocks. (E) Net C sequestration. (F) Net N sequestration. (G) C sequestration efficiency (C sequestration rate per unit of nitrogen addition). (H) N sequestration efficiency (N sequestration rate per unit of nitrogen addition). Note: Soils were sampled after 11 y of N addition; the single (*) and double asterisks (**) indicate that there are significant differences between N treatments and the controls at P < 0.1 and P < 0.05 levels, respectively; net soil C and N sequestration generally show increasing trends with greater rates of N addition, while soil C and N sequestration efficiency show decreasing trends; values are means with SE.

