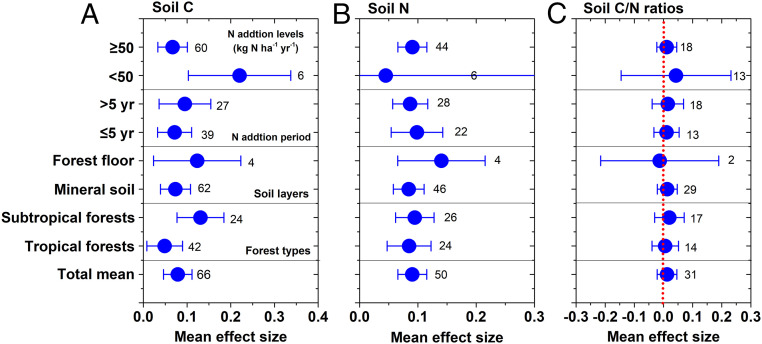
Fig. 4.
The mean effect sizes of experimental N addition on soil C (A), N (B), and C/N (C) ratios in the tropics. The variables are categorized into different groups depending on forest types, and N addition periods and levels. Error bars represent 95% confidence intervals (CIs). The dashed line was drawn at mean effect size of 0. The effect of N application was considered significant if the 95% CI of the effect size did not cover zero. The sample size for each variable is shown next to the point.

