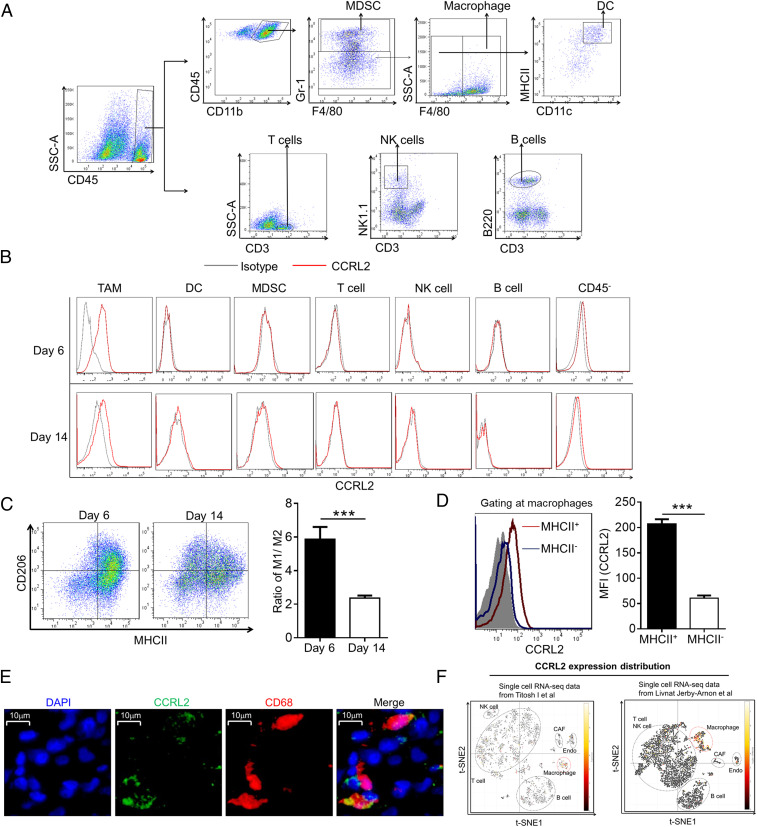
Fig. 2.
CCRL2 is selectively expressed in TAM with immunostimulatory phenotype. (A) Gating strategy for tumor-infiltrating immune cells. (B) Representative histograms measuring CCRL2 expression. (C) Representative dot plots of macrophages and the ratio of M1 to M2 macrophages in B16F10 tumors. (D) Representative histograms measuring CCRL2 expression in MHCII+ and MHCII− macrophages and average mean fluorescence intensity (MFI) values of CCRL2. (E) Representative images of immunostaining of human melanoma tissues for expression of CCRL2 (green) and CD68 (red). Tissues were counterstained with DAPI (blue) to detect nuclei. (F) t-SNE plot generated from two sets of published data via Single Cell Portal (singlecell.broadinstitute.org) showing relative expression levels of CCRL2 in different clusters of nonmalignant cells of human melanoma. Data represent mean ± SEM (n = 5) in C and D. Representative data from three experiments are shown. ***P < 0.001.

