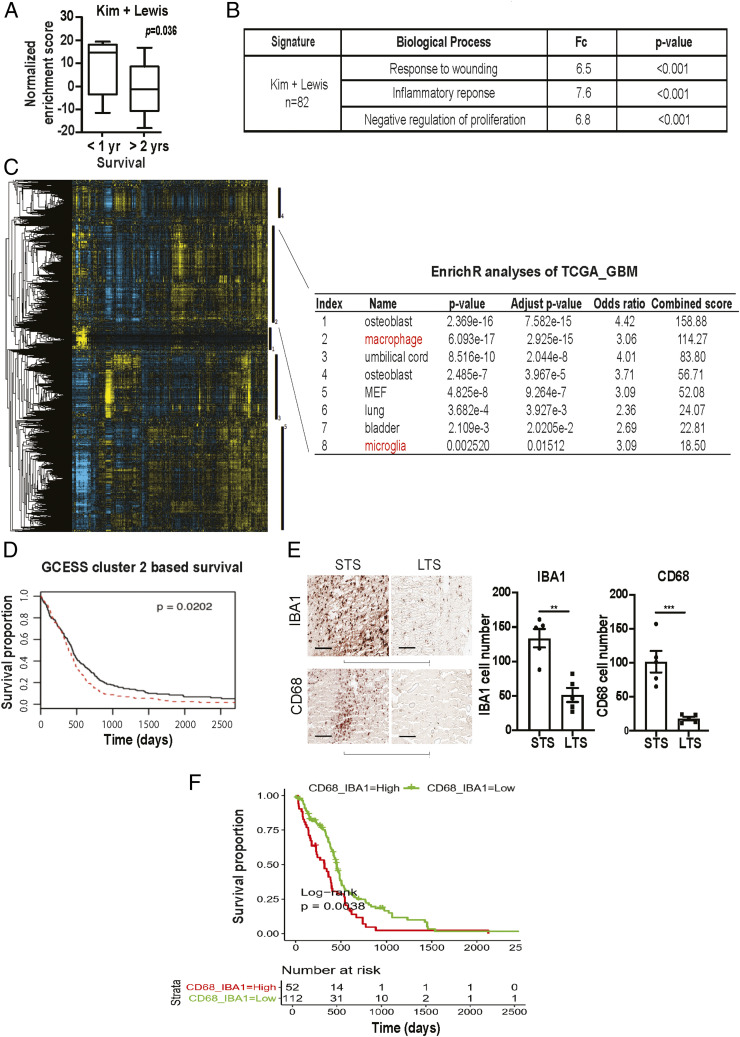
Fig. 1.
Survival analysis implicates contribution of glioblastoma-associated macrophages/microglia to clinical survival. (A) ssGSEA analysis demonstrating that the ssGSEA expression scores of the 82 survival-associated genes [combining the Kim (47) and Lewis (48) signatures] were significantly lower in the >2 y survivors relative to the <1 y survivors. These cohorts were matched for age and KPS. All patients underwent gross total resection and TMZ treatment. (B) Shown are the pathways enriched for the 82 survival-associated genes. (C and D) GCESS analysis of TCGA glioblastomas. Cluster of genes that are 1) highly correlated to one another and 2) associated with overall survival are shown as a heatmap; each column represents a gene, and each row represents a patient. The five survival-associated gene clusters are indicated by the vertical black bars (to the right of the heatmap). Macrophage/microglia gene signatures are enriched in cluster 2 (C). The higher expression of genes in cluster 2 was associated with poor clinical survival (D). High (in red) and low (in black) expression was defined based on median expression value. n = 539; P = 0.0202. (E) Immunohistochemical staining of macrophage and microglia markers, IBA1 and CD68, in CGGA patient cohort of long-term survival (LTS) and matched short-term survivals (STS). Each row represents an LST with a matched STS. Two representative matched pairs are shown. The statistics were derived from five matched pairs. **P < 0.01; ***P < 0.001. (F) Correlation between the expression of CD68 and IBA1 with the survival of TCGA glioblastoma patients. P = 0.038. n = 226.

