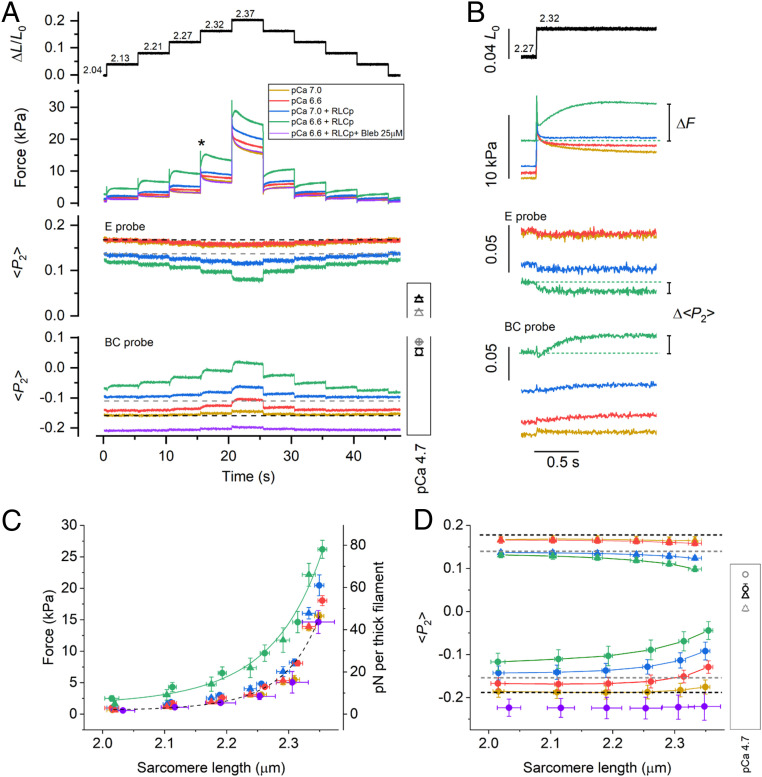
Fig. 4.
The effect of SL on RLC-lobe orientation in trabeculae activated at submaximal [Ca2+]. (A) Relative trabecular length change (ΔL/L0) and SL in µm calculated from the relation in SI Appendix, Fig. S3. Force and <P2> for E and BC probes during the stretch/release staircase recorded in single trabeculae at different [Ca2+] before and after RLC phosphorylation and in the presence of Blebbistatin 25 µM, as shown in the legend. Dashed lines: <P2> values in relaxing conditions (pCa 9) before (black) and after (gray) RLC phosphorylation. Values of <P2> for the two probes (E, triangles; BC, circles) during full calcium activation before (black) and after (gray) RLC phosphorylation are shown in the box (same as in Fig. 2A). Temperature, 26 °C; 3% Dextran T-500. (B) Traces at the time marked (asterisk) in A are shown on an expanded time scale; dashed lines indicate pre-stretch values. The dependence of force (C) and <P2> (D) on SL recorded before the stretch staircase and at 5 s after each stretch; triangles, E probe (mean ± SEM, n = 4); circles, BC probe (mean ± SEM, n = 4); same color code as in A. Data in the presence of 25 µM Blebbistatin (purple) are mean ± SD, n = 2. Dashed line in C is from Fig. 3B; solid line, curve fitted to green data points [F = exp(a + b × SL + c × SL2); a = 45.2, b = −47.1 µm−1, c = 12.4 µm−2]. Dashed lines in D: relaxed <P2> values at short SL before (black) and after (gray) RLC phosphorylation; active <P2> values are shown in the box (as in A).

