Fig. 3.
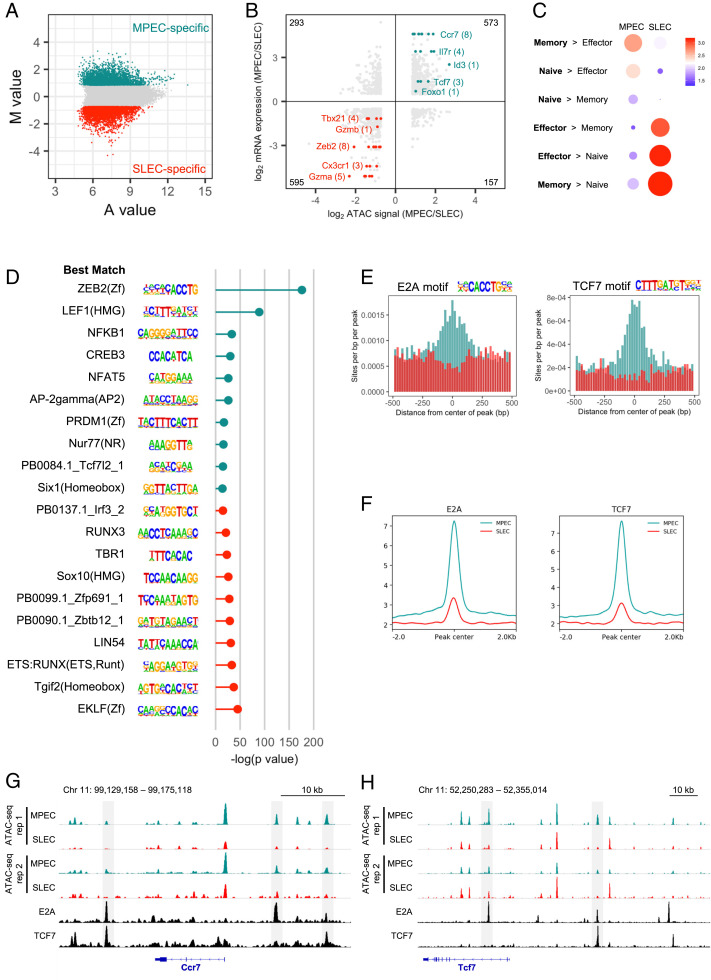
E2A and TCF7 binding sites are enriched in enhancers maintained in an open state by MPECs but not SLECs. (A) MA plot showing M value (log2 read density in MPEC ÷ read density in SLEC) versus A value (0.5 × log2 read density in MPEC × read density in SLEC) of the merged set of MPEC and SLEC nonpromoter ATAC-seq peaks after normalization. The top 5,000 peaks are highlighted for MPECs (cyan) and SLECs (red). (B) The log2 ratio of normalized ATAC-seq signal is compared to the log2 ratio of RNA expression for MPECs and SLECs. Only the top 5,000 MPEC- and SLEC-specific nonpromoter ATAC-seq peaks that are associated with genes that are significantly differently expressed between MPECs and SLECs are included, with the total number in each quadrant noted in each corner. Some notable genes with higher ATAC-seq signal and RNA expression in MPECs (cyan) or SLECs (red) are highlighted, with the number of enhancers in parentheses. (C) Gene ontology analysis for the MPEC- and SLEC-specific enhancers was performed using GREAT (55) and compared to published microarray gene sets of naïve, day 8 effector, and memory P14 CD8 T cells (56). Circle size denotes significance of gene set enrichment. Color represents fold enrichment. (D) The top 10 significantly enriched de novo motifs for each subset are shown, along with their significance (−log P value), ranked from most MPEC-specific (Top) to most SLEC-specific (Bottom). On the left is the best match known motif according to HOMER. (E) The distributions of the E2A and TCF7 motifs in the top 5,000 MPEC- and SLEC-specific enhancers are shown for the regions ± 500 bp from the center of each enhancer. (F) E2A (SRR3984693) (57) and TCF7 (SRR1024054) (58) ChIP-seq enrichment was assessed at the top 5,000 MPEC- and SLEC-specific enhancers (cyan and red, respectively). (G and H) MPEC and SLEC ATAC-seq data and E2A and TCF7 ChIP-seq data are shown at the Ccr7 (G) and Tcf7 (H) loci. Highlighted in gray are enhancers with higher ATAC-seq signal in MPECs than SLECs as well as E2A and/or TCF7 peaks.

