Fig. 4.
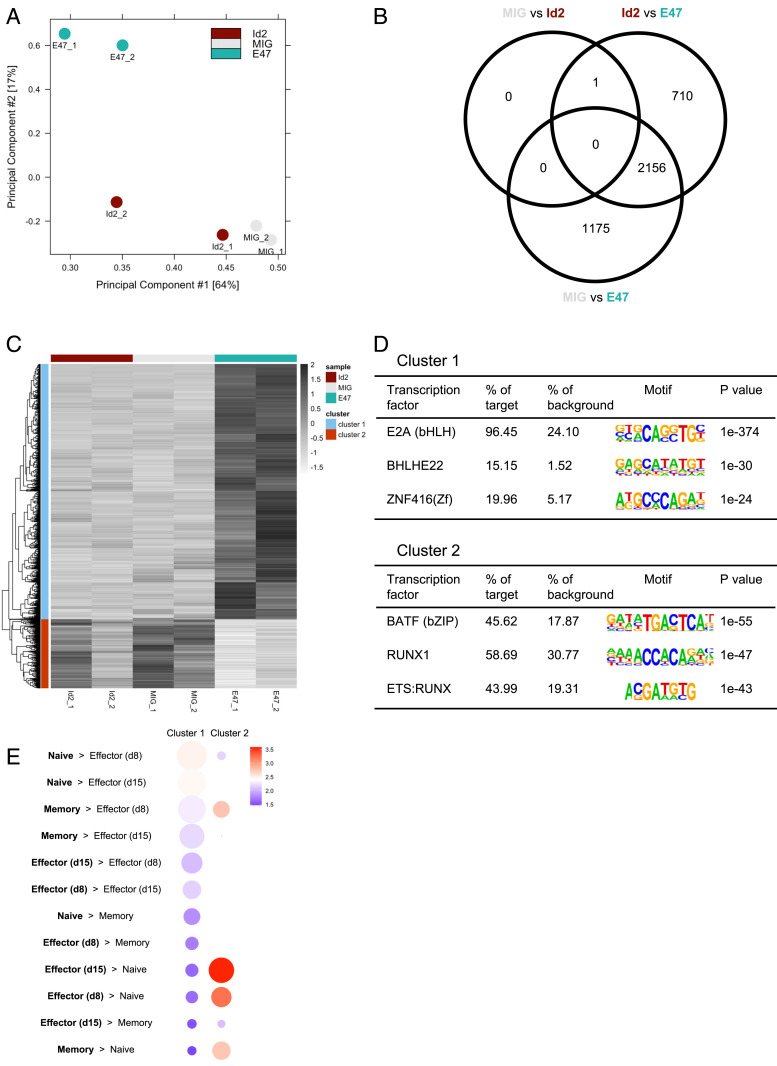
E2A regulates the accessibility of enhancers regulating memory T cell genes. (A) PCA plot comparing ATAC-seq signal in CD8 T cells transduced with empty MIG, MIG-Id2, and MIG-E47. (B) Venn diagram showing the number of enhancers with significantly different ATAC-seq signal in MIG versus MIG-E47, MIG versus MIG-Id2, and MIG-Id2 versus MIG-E47. (C) Heatmap showing hierarchical clustering of enhancers with significantly different ATAC-seq signal in the three groups. (D) Motif analysis with top three significantly enriched TF binding motifs in enhancers more open (Top) or more closed (Bottom) in E47 overexpressing cells. (E) Gene ontology analysis for cluster 1 and cluster 2 enhancers was performed using GREAT (55) and compared to published microarray gene sets of naïve, day 8 effector, day 15 effector, and memory P14 CD8 T cells (56). Circle size denotes significance of gene set enrichment. Color represents fold enrichment.

