Fig. 2.
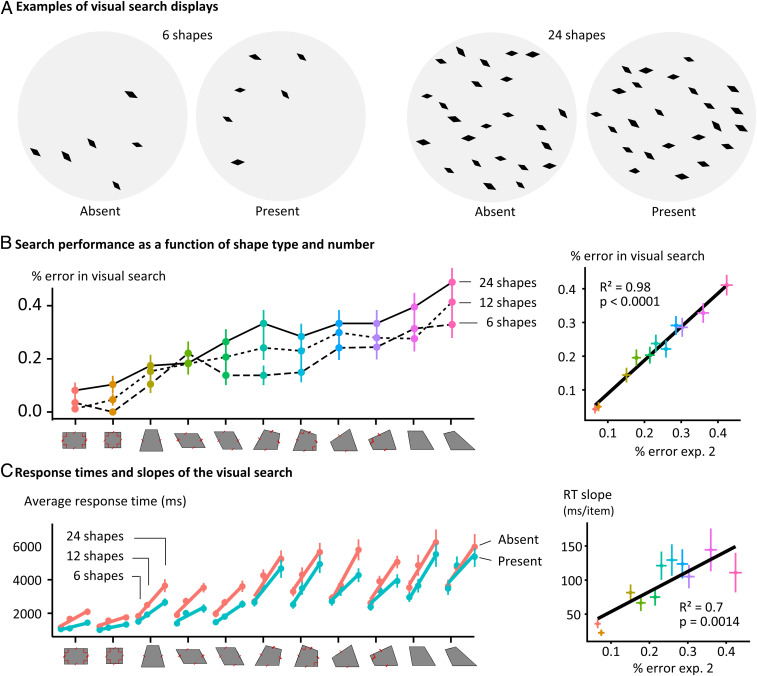
Visual search paradigm. (A) Examples of visual search displays. In the visual search task, 6, 12, or 24 shapes were randomly positioned inside a circle, and the participant had to decide whether all the shapes were identical, irrespective of rotation and scaling, or whether there was one that differed from the others. They gave their binary present/absent response by pressing one of two possible keys on the keyboard. (B) Error rates in the visual search task. Errors rates increased with both the number of shapes and their complexity (geometric irregularity). The latter effect closely correlated with the average error rate in the intruder task. (C) Search times. (Left) Slope of the visual search as a function of the number of displayed items, the presence or absence of an outlier, and the shape. (Right) Correlation between the slope of the visual search on present trials and the error rates of the intruder task (experiment 2).

