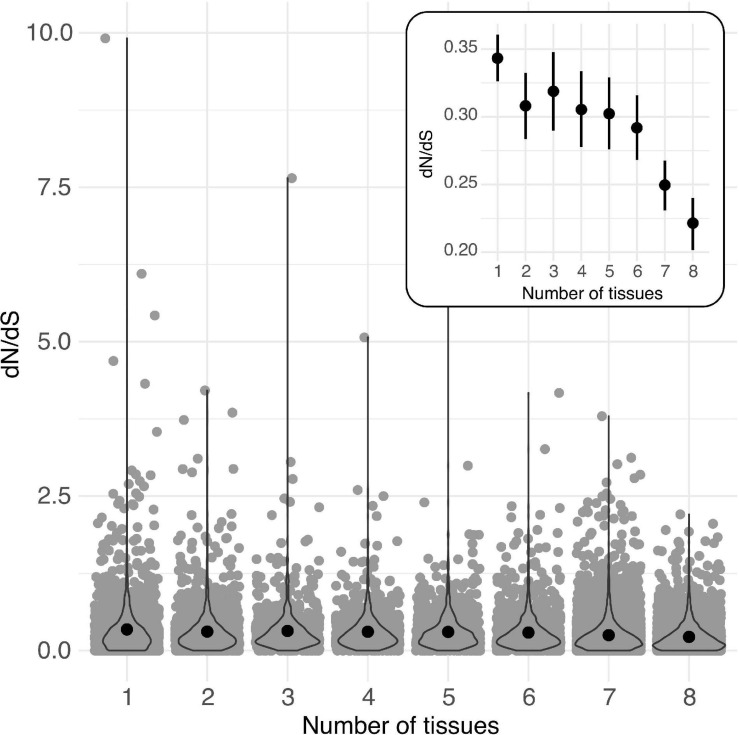
FIGURE 3.
Per locus protein evolution (dN/dS) among groups of loci expressed (>2 TPM) in different numbers of tissues (from 1 to 8) in Solanum species. Black circles indicate means for each group. Inset: Estimated mean (circle) and 95% CI of dN/dS for each group of loci. Overlaid violin plots show the distribution of each group of data.

