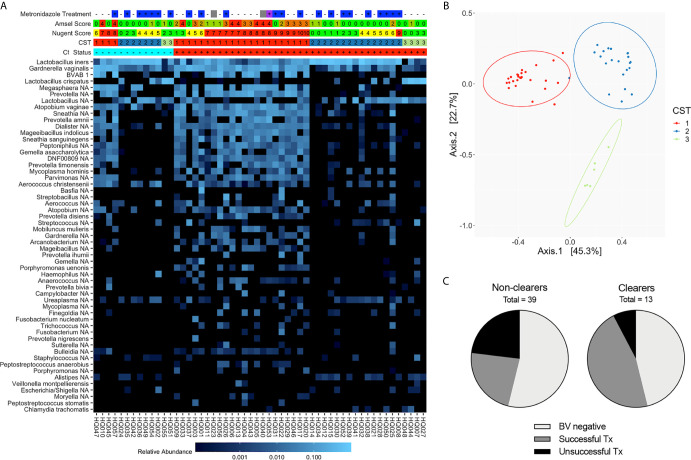
Figure 2.
Composition and structure of the vaginal microbiota at the Ct treatment/research enrollment visit (n=54). (A) Heatmap of the most abundant bacterial taxa identified by 16S rRNA V4 sequencing of vaginal swabs from Ct clearing and non-clearing women. Women are categorized by BV status using Amsel (0-4), Nugent (green, 0-4; yellow, 4-6; red, 7-10), and CST (1-3). Metronidazole treatment at the Ct treatment visit is noted (–, untreated; +, treated; blank, NA; blue, metronidazole; purple, Metrogel; gray, treated for BV but unknown if this was metronidazole or metronidazole gel). Ct status is + and red for Ct positive and – and blue for Ct clearer. The scale bar demonstrates relative abundance of each species. Results indicate that an optimal Lactobacillus-dominated microbiome is not necessary to clear Ct. (B) Principal coordinates analysis demonstrating clustering into three distinct CSTs. (C) Pie chart depicting the portion of Ct clearers and non-clearers that were clinically BV negative at the screening visit or their BV resolution status following metronidazole treatment; those women that did not adhere to metronidazole treatment were omitted.

