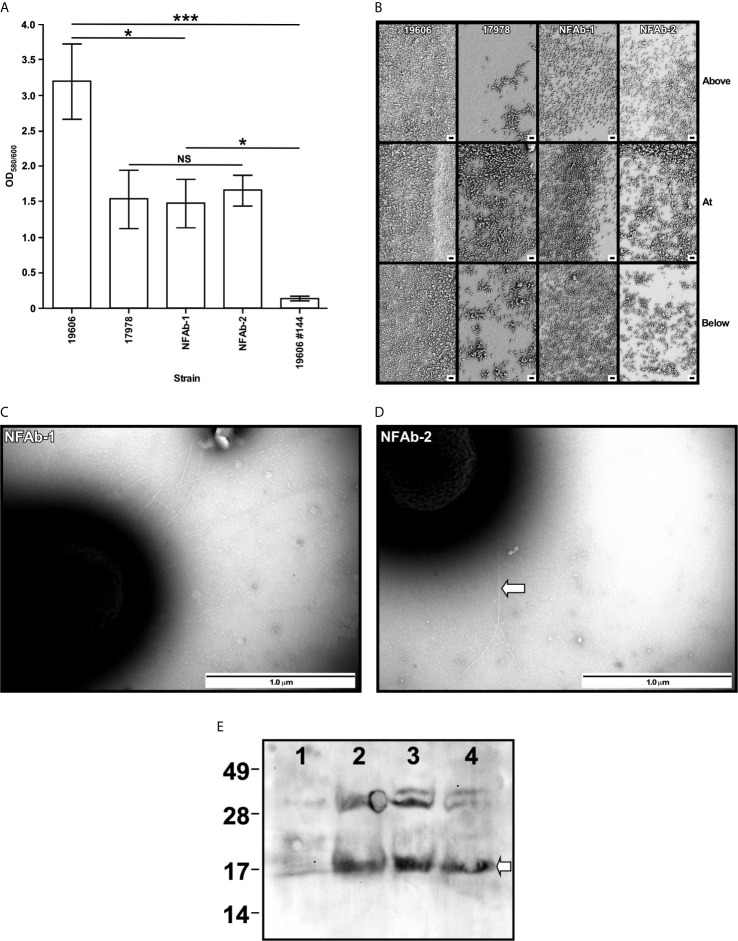
Figure 4.
Biofilm formation, pili detection and PilA production by A. baumannii strains. (A) The formation of biofilms on polystyrene tubes was detected after cells were incubated statically in MMB overnight at 37C. OD600 was used to determine the total cell mass of each tested sample. OD580 was used to determine the amount of biofilm formed on plastic tubes after staining with crystal violet and solubilization with acetone-ethanol. Triplicates of three independent biological samples were used to collect and analyze experimental data. Horizontal bars identify statistically different values (P ≤ 0.05, *; P ≤ 0.001, ***, NS, not significant) and error bars represent the standard error of each data set. (B) SEM of biofilms formed on the surface of plastic coverslips semi-submerged in MMB and statically incubated overnight at 37°C. Samples were examined above, at and below the liquid-air interface. Images are representative of at least three micrographs collected at 5,000X magnification for each biological sample. The black bars at the bottom right side of each panel represent a 2 µm size. (C, D) TEM of cells lifted form the surface of the Petri dishes after the agarose layer was removed from MMA plates. The horizontal white arrow in panel D identifies entangled pili forming bundles. Images are representative of at least three micrographs collected at a 60,000X magnification for each biological sample. (E) Detection of PilA in ATCC 19606T (lane 1), ATCC 17978 (lane 2), NFAb-1 (lane 3), and NFAb-2 (lane 4) total cell lysates. Numbers on the left indicate the position of molecular weight markers represented in kDa. The white arrow identifies the approximately 17-kDa PilA protein band.

