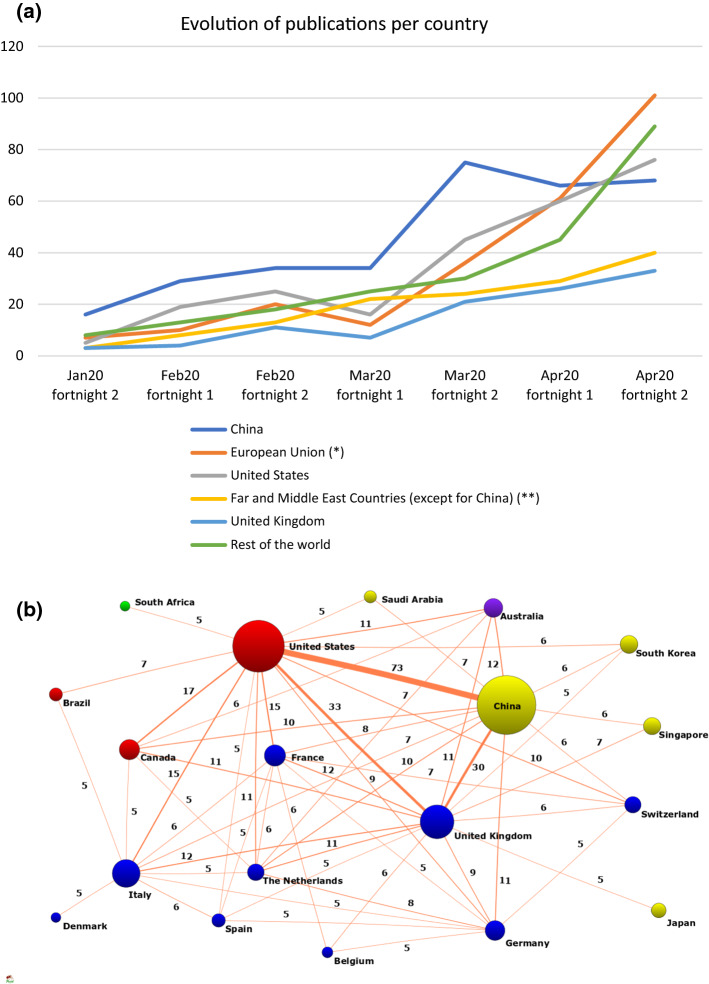
Fig. 3.
a Evolution of publications per authors’ country of affiliation. b International collaboration network. (The size of the node is proportional to the number of documents generated by each country. The color of the nodes is the same in all countries belonging to the same continent. The width of the lines represents the numbers papers in collaboration between the countries.)

