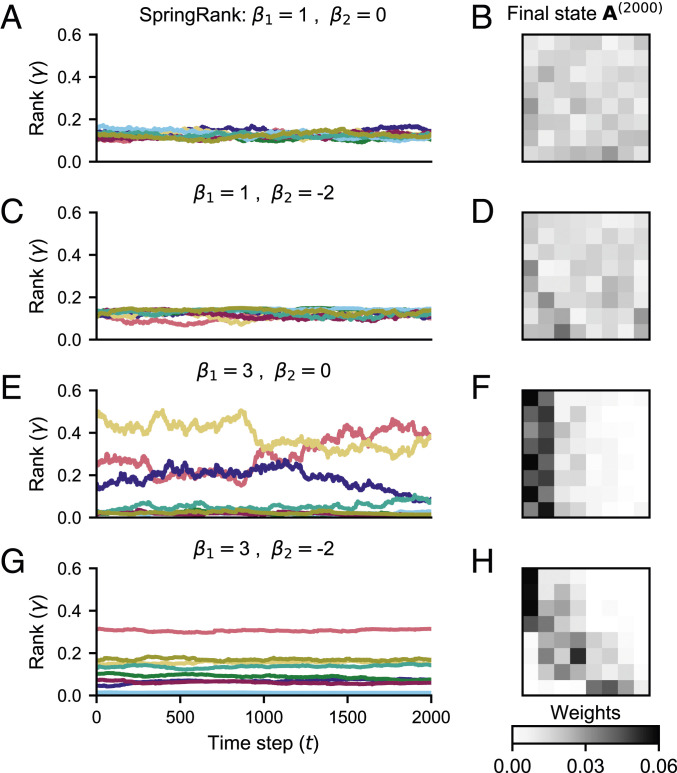
Fig. 2.
Representative dynamics of the proposed model. Each column shows a population of nodes simulated for 2,000 time steps using the SpringRank score function with update per time step, varying the preference parameters and . A, C, E, and G show the simulated rank vector over time; different colors track the ranks of different nodes. B, D, F, and H show the adjacency matrix at time step t = 2,000 for the corresponding parameter combinations. See SI Appendix, Fig. S1 for additional examples with SpringRank; SI Appendix, Fig. S2 for examples with PageRank; and SI Appendix, Fig. S3 for examples with Root-Degree. See SI Appendix, Fig. S4 for the dependence of rank variance on and jointly. Parameters: , .

