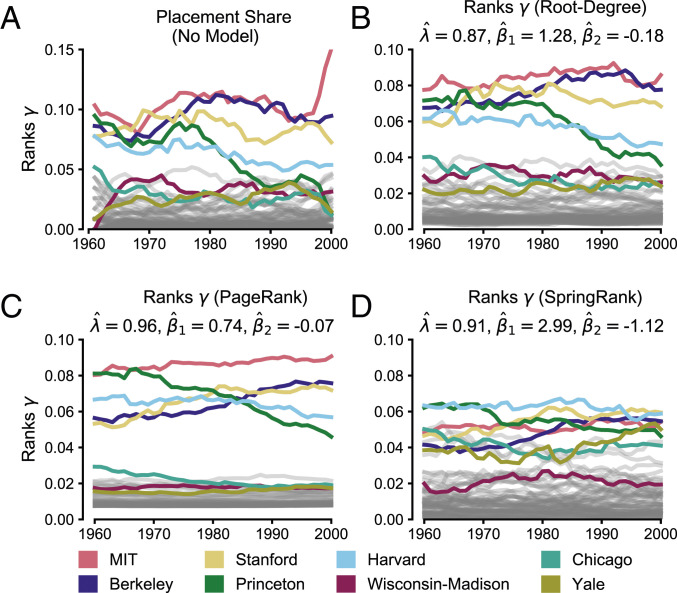
Fig. 4.
Visualization of evolving ranking functions in the Math PhD Exchange. (A) Fraction of all placements (number of graduates hired) from each school, shown as a moving average with bin-width 8 y for visualization purposes. (B) Inferred rank vector as a function of time using the Root-Degree score function. (C and D) As in B, with PageRank and SpringRank score functions, respectively. Parameters for B–D are shown in the first section of Table 1.

