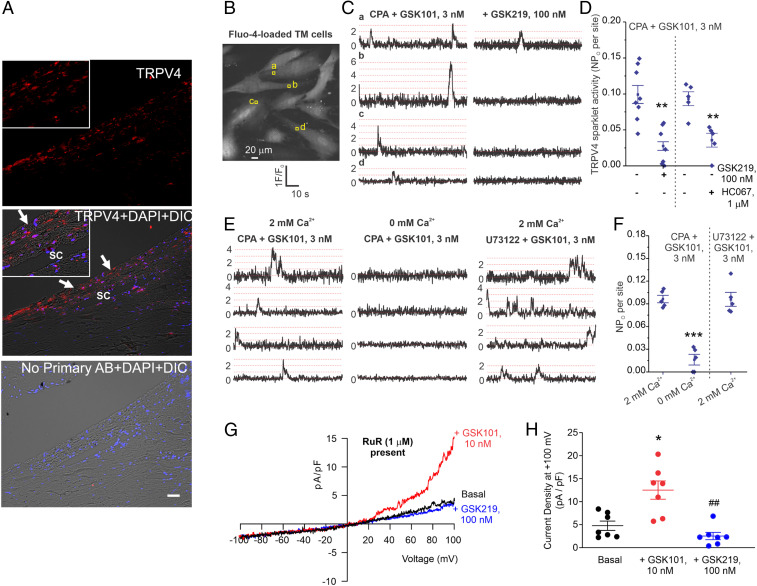
Fig. 1.
Expression of functional TRPV4 channels in human TM. (A) Immunohistochemical images showing expression of TRPV4 (red) in TM and SC endothelium of human donor eyes. No primary antibody control (Bottom). Inserts at the left corner of images show the blown out region of TM and SC. n = 5 different donors. (Scale bar, 50 μm.) (B) TRPV4 Ca2+ sparklets represent Ca2+ influx through TRPV4 channels on TM cell membranes. Grayscale image of a field of view with ∼10 TM cells; square boxes are the identifiers that represent the pixels with peak amplitudes at the TRPV4 sparklet sites. Experiments were performed in the presence of CPA (sarcoplasmic Ca2+-ATPase inhibitor, 20 μM) and GSK1016790A (GSK101, TRPV4 activator, 3 nM). (C) Representative F/F0 traces generated using the ROIs shown in B indicate GSK101-elicited TRPV4 sparklets. Dotted red lines represent quantal level or single-channel amplitude (0.29 ΔF/F0). (D) Averaged TRPV4 sparklet activity before or after the addition of TRPV4 inhibitor GSK219 (100 nM, n = 7 to 8) or HC067047 (HC067, 1 μM). n = 5 to 8, **P < 0.01 versus GSK101 (3 nM). TRPV4 sparklet activity is expressed as NPO per site. N represents the number of TRPV4 channels at a site, and PO is the open state probability of the channels. Representative F/F0 traces show TRPV4 sparklet activity at four different sites from a field of view (E) and averaged TRPV4 sparklet activity (F). Experiments were performed in the presence of CPA (20 μM) or U73122 (phospholipase inhibitor, 3 μM). (G) Representative traces for ionic currents through TRPV4 channels in TM cells under baseline condition and in the presence of GSK101 (10 nM), recorded in the whole-cell patch configuration. Experiments were performed in the presence of RuR (1 μM) to block Ca2+ entry at negative voltages. (H) Averaged outward currents in TM cells at +100 mV under basal conditions and in the presence of GSK101 (10 nM) or GSK101 + GSK219 (100 nM). n = 7, *P < 0.05 versus Basal, and ##P < 0.05 versus GSK219. Data are presented as mean ± SEM.

