Fig. 4.
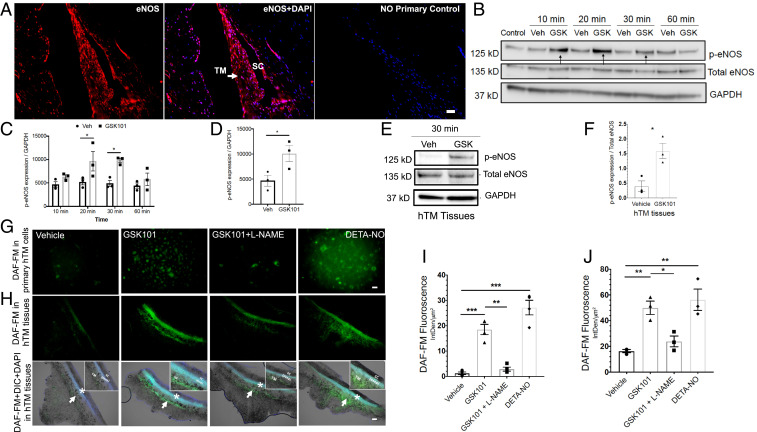
TRPV4 channels are functionally coupled to eNOS in human TM cells and tissues. (A) Immunohistochemical images showing expression of eNOS (red) in the human TM and SC endothelium (n = 6). Nuclei were counterstained with DAPI (blue; center image). No primary antibody control (Right). (Scale bar, 50 μm.) (B and C) TRPV4 activation leads to phosphorylation of eNOS in TM cells. Representative Western blot image (B) and densitometric analysis (C) showing expression of p-eNOS, total eNOS, and glyceraldehyde 3-phosphate dehydrogenase (GAPDH) in lysates from cultured transformed TM cells (GTM3) treated with 20 nM GSK101 or 0.001% DMSO vehicle for 10, 20, 30, and 60 min intervals. *P < 0.05 versus vehicle at same time point, n = 3/group; unpaired two-tailed t test. (D) Densitometric analysis of Western blot for p-eNOS levels in primary human TM cells treated with 20 nM GSK101 or 0.001% DMSO vehicle. *P < 0.05 versus vehicle, n = 3 donors/group; unpaired two-tailed t test. (E and F) TRPV4-mediated phosphorylation of eNOS in human donor TM tissues. Representative Western blot (E) showing expression of p-eNOS, total eNOS, and GAPDH in ex vivo cultured human TM tissues treated with 20 nM GSK101 and 0.01% DMSO vehicle. Densitometric analysis (F) compares levels of p-eNOS over eNOS between the groups. *P < 0.05 versus vehicle, n = 3/group; unpaired two-tailed t test. (G–J) TRPV4 activation leads to NO production in primary TM cells and ex vivo cultured human TM tissues. Images and comparisons of DAF-FM intensity (IntDen/μm2) in normal primary human TM cells (G and I) and ex vivo cultured human TM tissues (H and J) treated with 0.001% DMSO vehicle, 20 nM GSK101, 20 nm GSK101 + 100 μM l-NAME, or 100 μM DETA/NO. Arrows indicate TM, and * indicates SC region (H). Insets on the right corner of bottom images show blown out regions of TM and SC. (Scale bar, 50 μm for H and 100 μm for J.) *P < 0.5; **P < 0.01; ***P < 0.001, n = 3 cell strains/group; one-way ANOVA followed by Bonferroni’s post hoc test.

