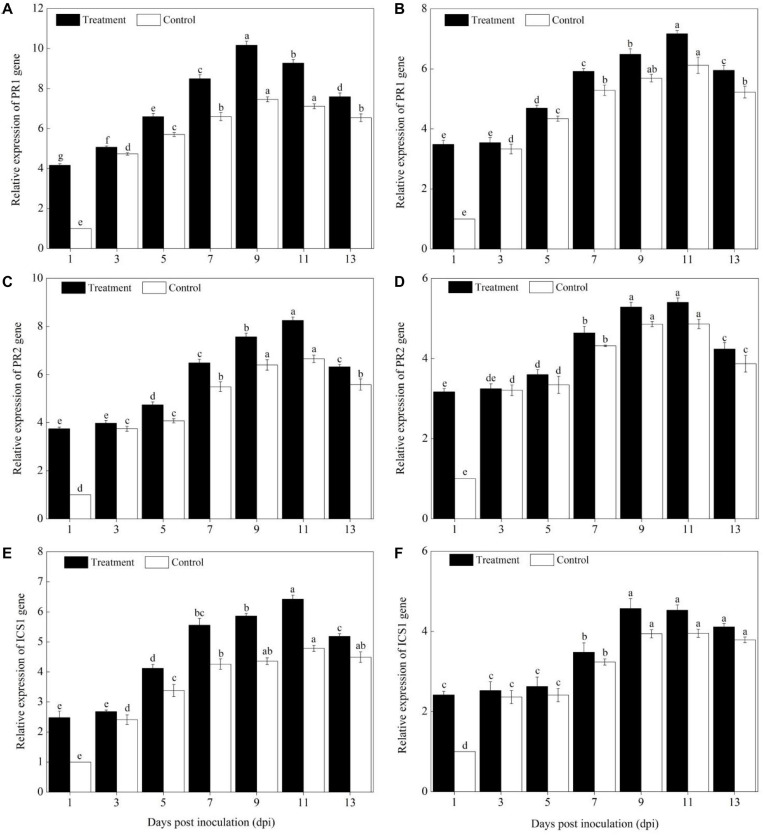
FIGURE 6.
Expression levels of SA signaling pathway marker genes in the leaves of Sixing F1 and Jin12 F1 at different time points after being inoculated with Podosphaera xanthii. (A,C,E) The expression levels of PR1, PR2, and ICS1 genes in Sixing F1, respectively; (B,D,F) the expression levels of PR1, PR2, and ICS1 genes in Jin12 F1, respectively. The line bars, different letters, and treatments are detailed in the footnote of Figure 2 and Table 2.

