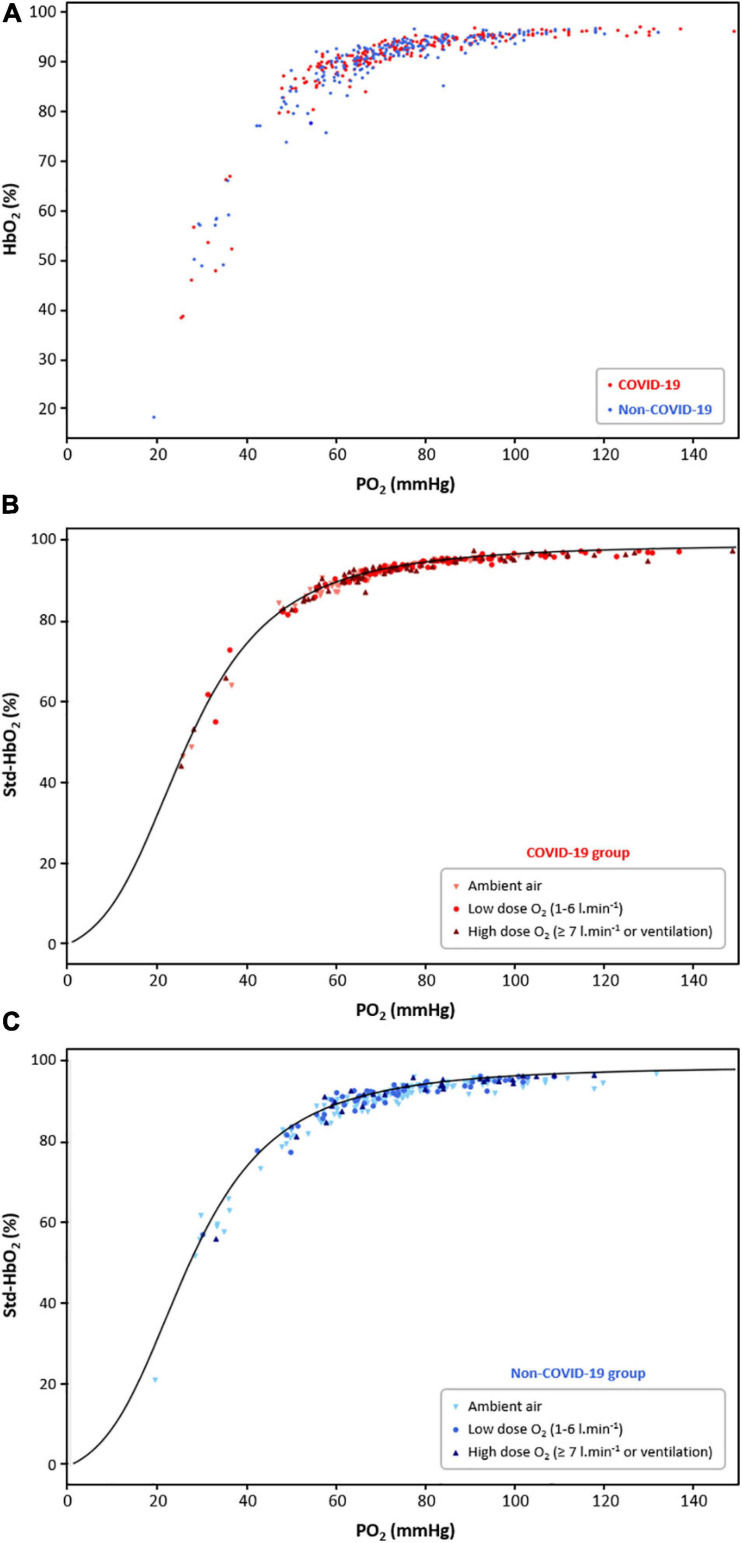
FIGURE 1.
(A) Raw oxyhemoglobin (HbO2) in relation to PO2 in the COVID-19 group (red dots, 100 patients, 253 samples) and the non-COVID-19 group (blue dots, 100 patients, 221 samples). (B) Standardized HbO2 (Std-HbO2) in relation to PO2 in the COVID-19 group, according to the level of oxygen therapy (light red triangles: ambient air; medium red dots: O2 between 1 and 6 l.min− 1; dark red triangles: O2 ≥ 7 l.min− 1 or ventilation). Measured HbO2 was standardized for normal conditions (temperature = 37°C; pH = 7.4; PCO2 = 40 mmHg) in order to compare it to the predicted HbO2 given by the standard O2-Hb dissociation curve, represented in black. (C) Std-HbO2 for normal conditions in relation to PO2 in the non-COVID-19 group, according to the level of oxygen therapy (light blue triangles: ambient air; medium blue dots: O2 between 1 and 6 l.min− 1; dark blue triangles: O2 ≥ 7 l.min− 1 or ventilation).

