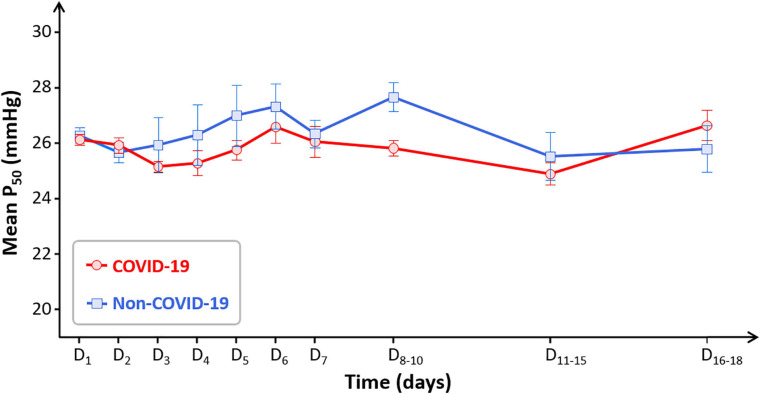
FIGURE 2.
Time-course of mean P50 in the COVID-19 group (red circles) and the non-COVID-19 group (blue squares). Some days were regrouped to have sufficient number of samples (D8–10: n = 15 in the COVID-19 group and n = 10 in the non-COVID-19 group; D11–15: n = 11 in both groups; D16–18: n = 4 and n = 6, respectively). Data are presented as means and SE.

