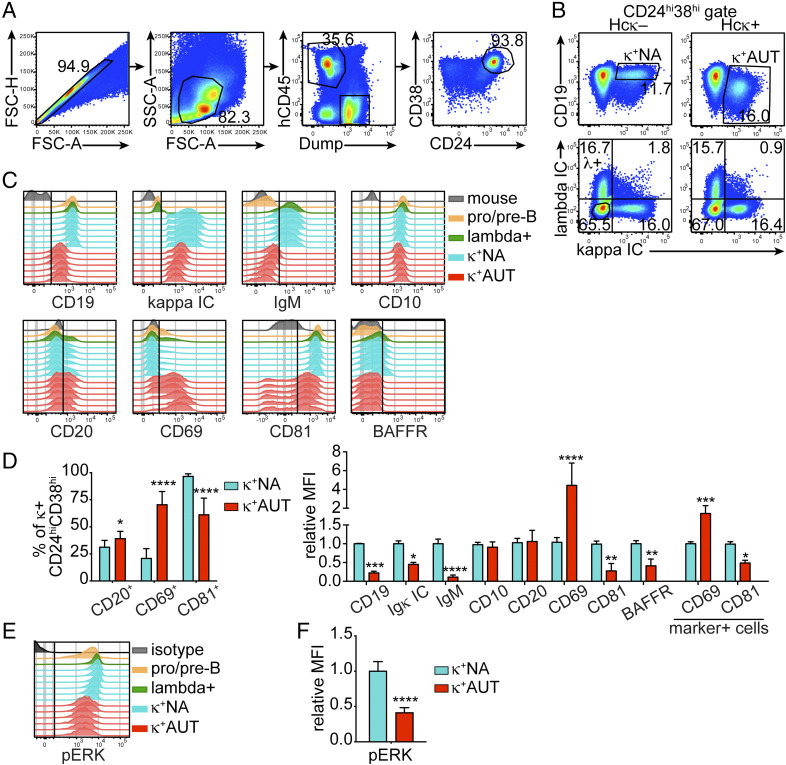
Fig. 1.
Analysis of Hcκ transgenic hu-mice uncovers markers that distinguish human autoreactive from nonautoreactive immature B cells. Bone marrow cells from Hcκ− and Hcκ+ HIS hu-mice were analyzed by flow cytometry 13 to 15 wk after engraftment of hHSCs. (A) Strategy for gating human CD24hiCD38hi developing B cells in the bone marrow of HIS hu-mice (SI Appendix, Fig. S1A). The dump channel excludes cells positive for hCD3 (human T cells), hCD14 and hCD33 (human monocytes and macrophages), mCD45 (mouse hematopoietic cells), and dead cells. (B) Representative analysis of surface CD19 and IC Igκ (Top) and IC Igκ and Igλ (Bottom) in human CD24hiCD38hi B cells from bone marrow of hu-mice. The top plots display the gating of CD19hi κ+ nonautoreactive (κ+NA) B cells in Hcκ− bone marrow and of CD19low κ+ autoreactive (κ+AUT) B cells in Hcκ+ bone marrow. The bottom plots show the gating of pro/pre-B cells (circle gate in the κ–λ−, double-negative quadrant). (C) Histogram plots displaying expression of indicated molecules by the following cell populations: mouse cells (hCD45−Dump+), pro/pre B cells (CD24hiCD38hiκ−λ−), λ+ immature B cells from Hcκ+ (CD24hiCD38hiκ−λ+), κ+NA immature B cells (CD24hiCD38hiCD19hiκ+ from Hcκ−), and κ+AUT immature B cells (CD24hiCD38hiCD19lowκ+ from Hcκ+). Each histogram represents a mouse, and the data are from littermates transplanted with HSCs from the same cord blood donor. (D) Frequencies of marker-positive cells (Left) and relative MFI of indicated markers (Right) among the human κ+NA or κ+AUT CD24hiCD38hi B cells of Hcκ+ and Hcκ− hu-mice generated with different cord bloods. Markers were analyzed as shown in C. (E and F) Representative flow cytometric analysis of pERK in pervanadate-treated human B cell subsets (E) and relative MFI of pERK in κ+NA and κ+AUT immature B cells from Hcκ+ and Hcκ− hu-mice generated with different cord bloods (F). The isotype control–stained sample represents CD38hi cells from a Hcκ− hu-mouse. The MFIs for graphs in D and F were normalized by dividing the MFI values of κ+AUT and κ+NA cells from individual mice to the average MFI of κ+NA cells from Hcκ− mice analyzed on the same day. Results in all graphs are expressed as mean and SD. n = 10 Hcκ+ and 13 Hcκ− hu-mice generated with three or four different CBH samples, respectively. Statistical analysis was performed with two-way ANOVA multiple comparison test. *P < 0.05; **P < 0.01; ***P < 0.001; and ****P < 0.0001.

