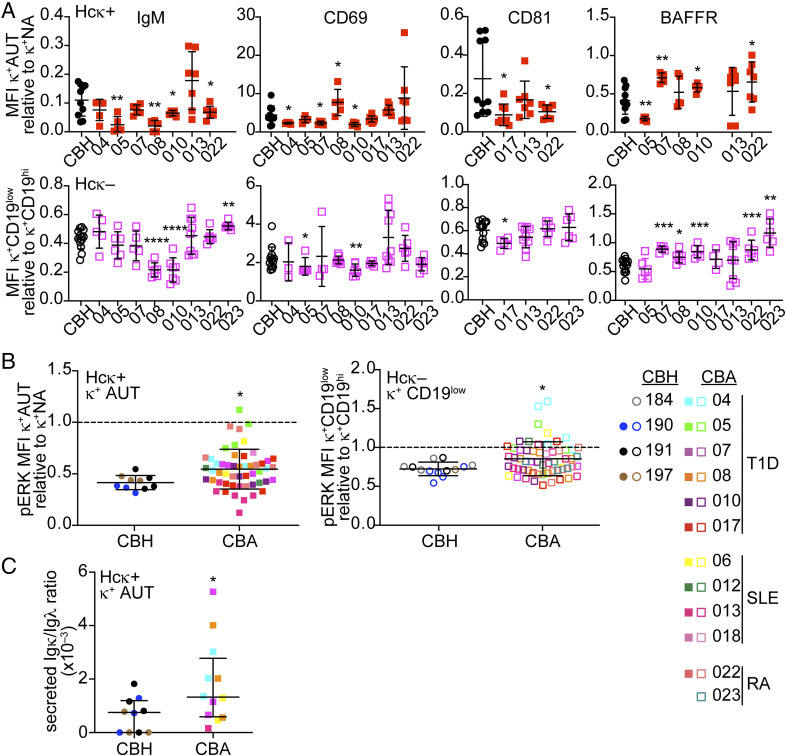
Fig. 4.
HSCs from some autoimmune-prone newborn infants lead to differences in the expression of B cell tolerance markers in hu-mice. HIS hu-mice were generated with HSCs enriched from cord blood samples collected from newborns of either healthy or autoimmune mothers. (A) Relative MFI of indicated markers among the CD19low κ+ human immature B cells from Hcκ+ hu-mice (Top) or Hcκ− hu-mice (Bottom) that were generated with cord blood from newborns of either “healthy” (circles) or distinct “autoimmune” (squares) mothers. CBA-05 was a carrier of the PTPN22 W620 genetic variant. Groups of hu-mice generated with different CBA samples are separated in the graphs, while those generated with CBH samples are displayed in the same group. Only CBA groups with 3 or more observations were plotted in the graphs. CD19low CD24hiCD38hi immature B cells were gated as shown in Figs. 1 A and B and 2A. Filled and empty symbols represent Hcκ+ and Hcκ− hu-mice, respectively. (B) Relative MFI of pERK in pervanadate-treated human CD19low κ+ human immature B cells from Hcκ+ (Left) and Hcκ− (Right) hu-mice generated with CBH or CBA cord bloods. Each symbol is a mouse and symbols and colors are the same as in A. The MFIs for graphs in A and B were normalized by dividing the MFI values of CD19low κ+ cells of individual mice to the average MFI of CD19hi κ+ cells from hu-mice analyzed on the same day. (C) Ratio of secreted Igκ to Igλ in serum of individual Hcκ+ hu-mice generated with CBH or CBA cord blood samples. Results in all graphs are expressed as mean ± SD. n = 10 Hcκ+ and 13 Hcκ− hu-mice generated with three or four different CBH samples, respectively. n = 53 Hcκ+ hu-mice and 58 Hcκ− hu-mice generated with HSCs from 11 or 12 CBA individual cord blood samples, respectively. Statistical analysis was performed with two-way ANOVA multiple comparison test. *P < 0.05; **P < 0.01; ***P < 0.001; and ****P < 0.0001.

