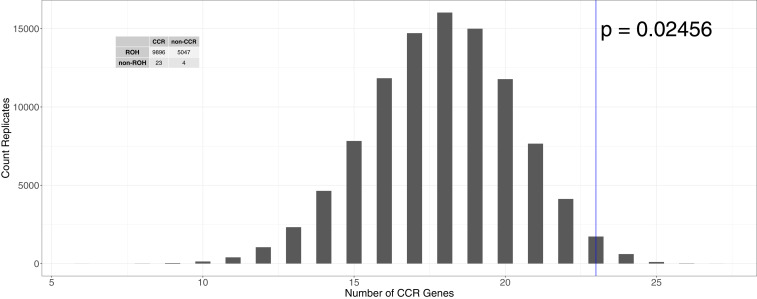
Fig. 4.
Histogram of the expected number of genes that fall into the top 10% CCRs over 100,000 randomly drawn sets of 27 genes. The empirical data are demarcated by the blue line (P = 0.025). The contingency table shows the count of genes classified as to whether all exons overlap an ROH (“ROH”) and whether any exons overlap a CCR (“CCR”). There is a 2.94-fold enrichment of genes with at least one exon without an ROH (“non-ROH” genes) in CCRs (P = 0.041) relative to genes where all exons overlap an ROH.

