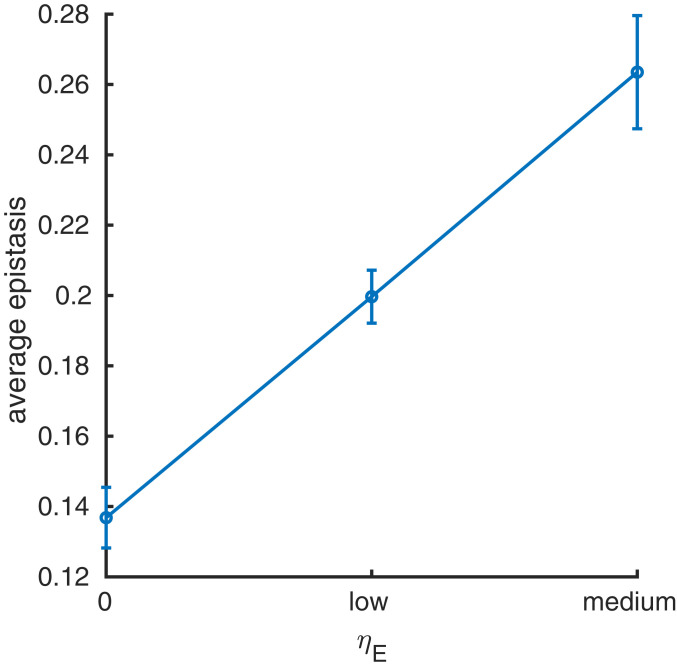
Fig. 3.
The mean absolute epistasis in protein stability (y axis), averaged over all 10 simulations, between each pair of native contacts when evolving proteins under increasing selection ( = 0, low, medium) for the absolute epistasis in protein stability at the native contacts (x axis). The error bars depict the variance in the mean. The average absolute epistasis between native contacts increases as the value of the selection coefficient increases.

