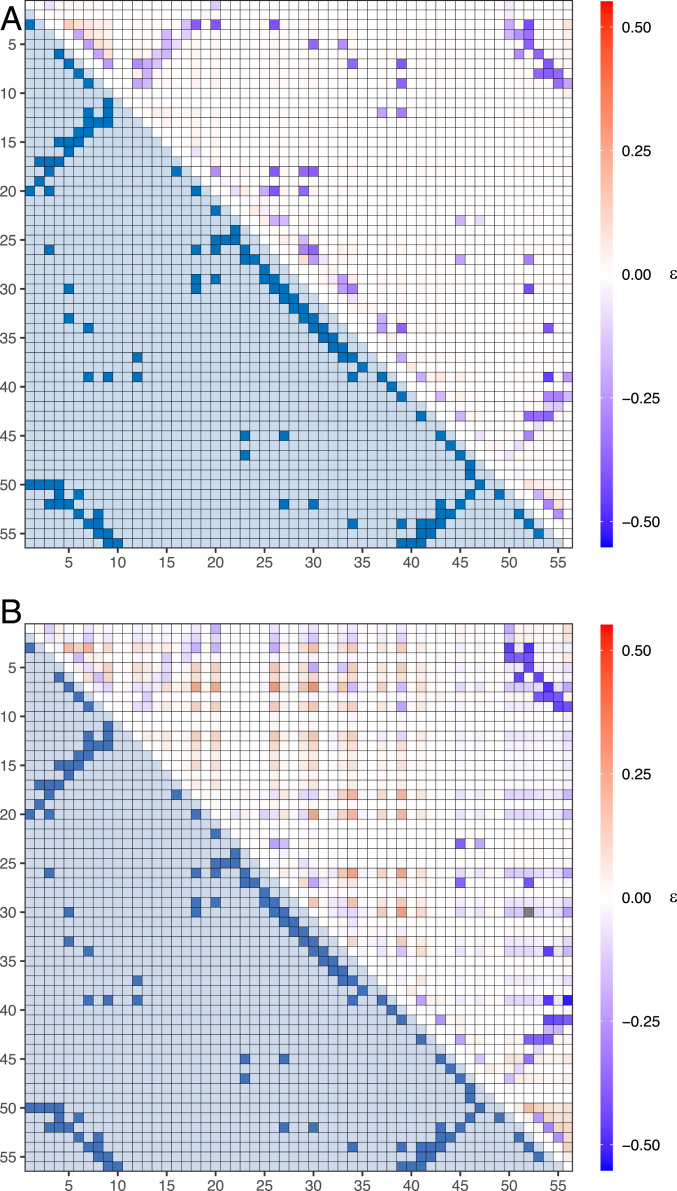
Fig. 8.
The average epistasis between each possible pair of residues for (A) a two-state and (B) a three-state system. The upper triangle of each heat map is the calculated epistasis, and the lower triangle is the contact map for the GB1 protein, where a value of 1 means the residues are in contact in the native state. The epistasis for the two-state system accurately maps out the structure of the GB1 protein, with the majority of native contacts experiencing high magnitudes of negative epistasis. For the three-state system, the native contact map becomes obscured by high levels of positive epistasis at nonnative contacts. These results suggest epistatic measurements work well when reconstructing the native state of two-state systems, but are less successful for multistate systems.

