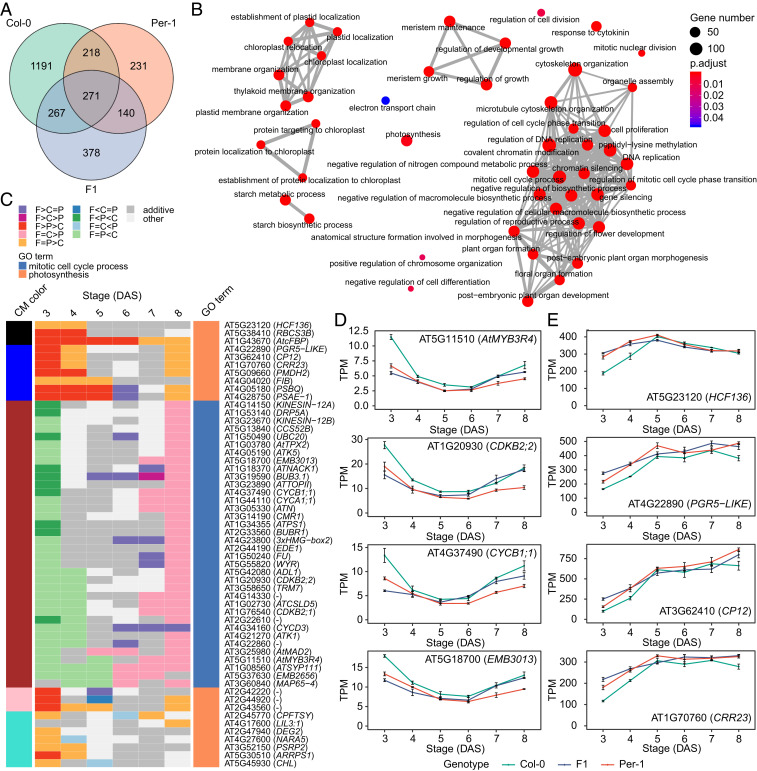
Fig. 3.
Hub genes in the core gene coexpression network underlying the dynamic regulation of early shoot development. (A) Venn diagram showing the shared hub genes between Col-0, Per-1, and the F1 hybrid. (B) GO enrichment analysis of the hub genes in A. Dot color intensity represents the significance (adjusted P value) of the GO term enrichment, and dot size indicates the number of genes in each GO term. (C) Heat map showing the hybrid’s complementary differential expression patterns (adjusted P < 0.05) for hub genes involved in the mitotic cell cycle and photosynthesis. The cell colors represent differential expression patterns, and the colors on the Left and Right represent the corresponding consensus module (CM) and GO term to which each gene belongs, respectively. C, Col-0; P, Per-1; F, F1; DAS, days after sowing. (D and E) Expression levels of representative hub genes involved in the mitotic cell cycle process (D) and photosynthesis (E) across 3–8 DAS. Data are mean TPM ± SE in each genotype at each stage (n = 3).

