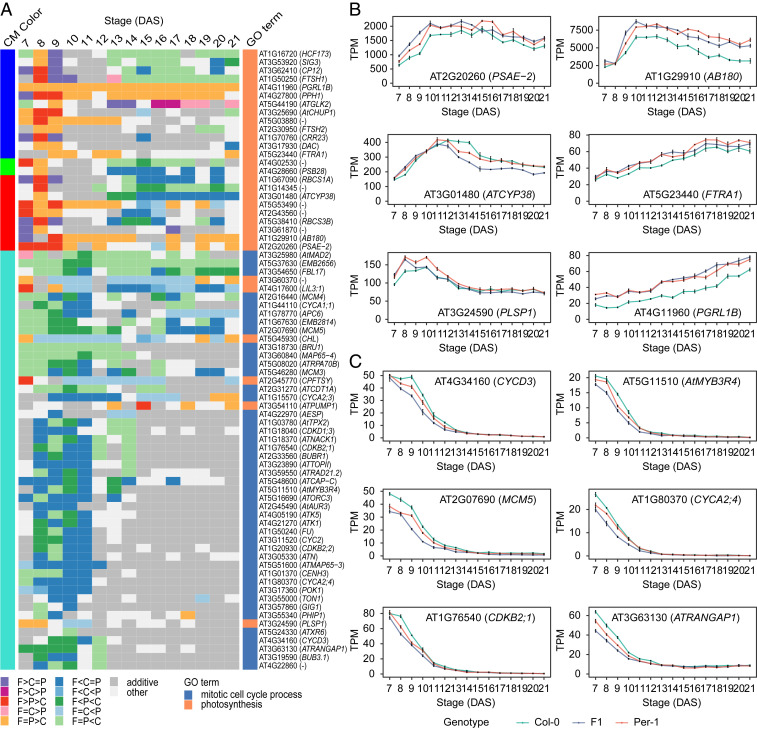
Fig. 4.
Differential expression patterns of the cell cycle and photosynthesis associated hub genes in the core regulatory network of true leaf development between the hybrid and its parents. (A) Heat map showing the differential expression patterns of hub genes involved in the mitotic cell cycle and photosynthesis in the first true leaf of the F1 hybrid (F) and its parents (C, Col-0; P, Per-1) (adjusted P < 0.05) across 7–21 d after sowing (DAS). The cell colors represent the differential expression patterns, and the colors on the Left and Right of the heat map represent the corresponding consensus module (CM) and GO term to which each gene belongs, respectively. (B and C) Expression levels of representative hub genes involved in photosynthesis (B) and the mitotic cell cycle process (C) across 7–21 DAS. Data are mean TPM ± SE in each genotype at each stage (n = 3).

