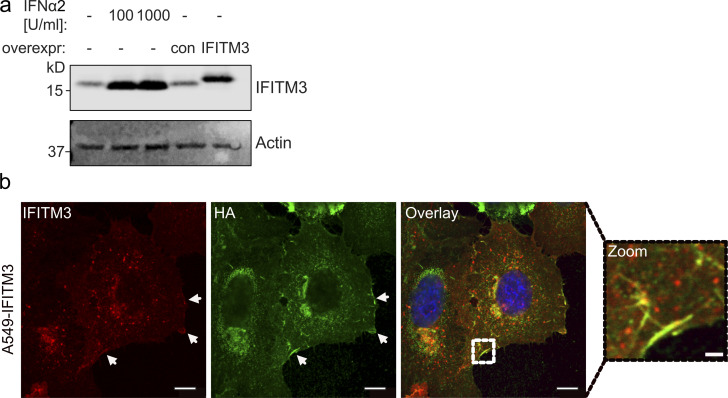
Figure S4.
IFITM3 is expressed to similar levels in A549-IFITM3 and IFN-treated A549 cells and colocalizes with HA during IAV infection. (a) A549 cells were treated with 0, 100, or 1,000 U/ml IFN-α2 for 16 h before cells were lysed. In parallel, lysates of A549 control cells or A549-IFITM3 cells were prepared, and all lysates were tested for IFITM3 expression by Western blot. Actin staining was included as loading control. (b) A549-IFITM3 cells were infected with A/WSN/1933 (MOI 1) for 16 h. Cells were fixed and stained for DAPI (blue), HA (green), and IFITM3 (red). Samples were analyzed by confocal microscopy and a representative cell is shown with the indicated zoom area. Areas of colocalization at the plasma membrane are highlighted by arrows. Scale bars correspond to 25 µm or 1.5 µm for the higher magnification.

