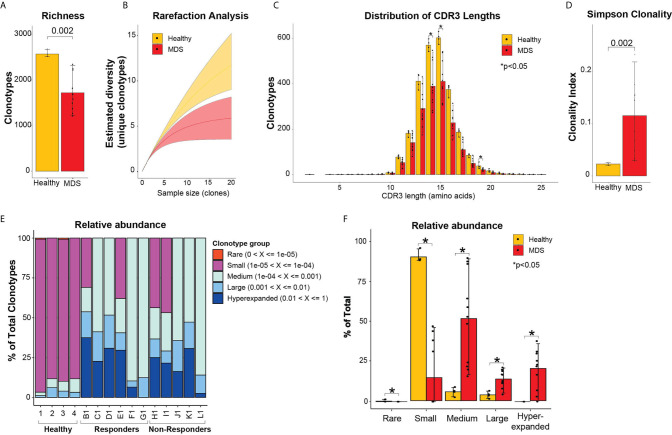
Figure 1.
Diversity TCR metrics in healthy and pre-treatment MDS bone marrows. (A) Richness and (B) rarefaction analysis between healthy and pre-treatment MDS bone marrows for estimation of diversity. (C) Distribution of CDR3 lengths in healthy and pre-treatment MDS bone marrows. (D) Simpson clonality index as measurement of degree of clonality. (E) Relative abundance of the different clonotype groups based on the frequency of clonotype. (F) Barplot representation of the relative abundance measurements in (E). *p < 0.05.

