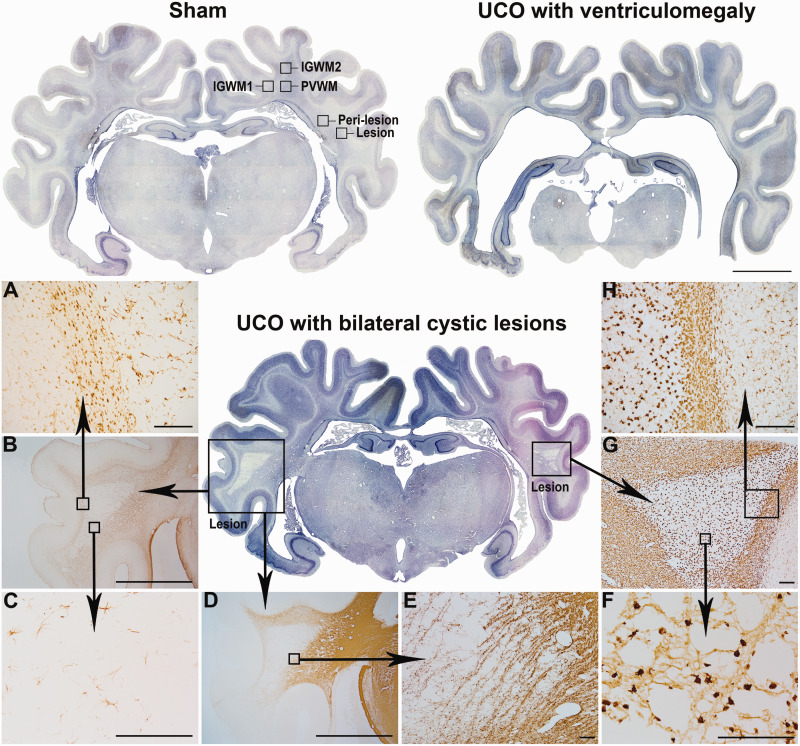
Figure 1.
Spectrum of macroscopic white matter degeneration at 21 days. Examples of whole coronal sections after 21 days of recovery in the sham group with regions of interest labelled (top left) and the two predominant patterns of macroscopic WMI in the 21d-UCO group: White matter atrophy with ventriculomegaly (top right) and bilateral cystic white matter lesions (centre) which were primarily observed in the temporal lobe white matter. Serial images were taken at ×2.5 magnification and stitched together (scale bar = 1000 µm). (A−H) Representative higher magnification photomicrographs of the cystic lesions. (A−C) (Taken at ×10, ×2.5, ×20, respectively) show GFAP-positive astrocytes illustrating that a dense border of astrogliosis formed around the perimeter of the lesions (A) while a marked reduction in the numbers of astrocytes was observed within the centre of the lesion (C). (D−E) (Taken at ×2.5 and ×4, respectively) show that MBP-positive myelin was severely disrupted within and surrounding the lesion. (F−H) (Taken at ×40, ×4 and ×10, respectively) show Iba-1-positive microglia with darkly stained amoeboid morphologies in the centre of the lesion (F) and a dense border of amoeboid microglia surrounding the perimeter of the lesion (H). (Scale bar = 1000 µm for ×2.5, 200 µm for ×4, ×10 and ×20 magnifications, and 100 µm for ×40 magnification).

