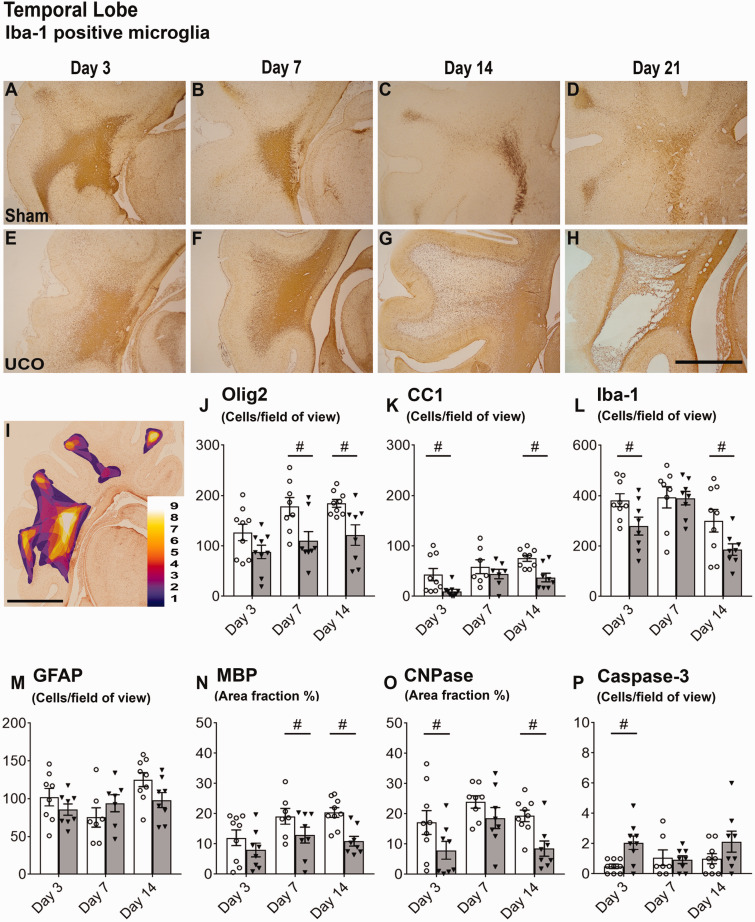
Figure 3.
Evolution of cystic lesions and histological outcomes in temporal white matter. Top panels: evolution of cystic lesions in the temporal lobe (A−D sham, E−H umbilical cord occlusion, UCO). Images are coronal sections stained with Iba-1 taken at ×2.5 magnification (scale bar = 1000 µm). Note the large microglial aggregates in the 3d-sham and 3d-UCO groups (A and E) and 7d-sham and 7d-UCO groups (B and F), the marked dispersal of microglia in the 14d-UCO group (G) and the cystic lesion surrounded by a gliotic barrier in the 21d-UCO group (H). (I) A coronal section stained with Iba-1 from the 3d-sham group showing both the parietal and temporal lobe, overlaid with a heat map demonstrating the location of Iba-1-positive microglial aggregates across the 3d-sham group (scale bar = 1000 µm). Colours correspond to the number of foetuses in the 3d-sham group showing a microglial aggregate in that region. Note the frequent, large microglial aggregate within the temporal white matter. Bottom panels (J−O): histological outcomes from the centre of the temporal lobe at 3, 7 and 14 days after sham occlusion (white columns) and UCO (grey columns). Two-way ANOVA including time as a repeated measure showed an overall significant reduction in Olig-2 (J) and CC1 (K) positive oligodendrocytes and CNPase (N) positive myelin (P < 0.05). Statistical significance shown in the figure was determined on individual time-points by one-way ANOVA (#P < 0.05 sham versus UCO). Data are means ± SEM. N = Sham/UCO, Olig-2: 3d 9/9, 7d 8/8, 14d 9/8. CC1: 3d 9/9, 7d 7/7, 14d 9/8. Iba-1: 3d 9/8, 7d 8/8, 14d 9/8. GFAP: 3d 8/8, 7d 7/7, 14d 9/8. MBP: 3d 9/8, 7d 7/8, 14d 9/8. CNPase: 3d 9/8, 7d 8/8, 14d 9/8. Caspase-3: 9/9, 7d 7/8, 14d 9/8.

