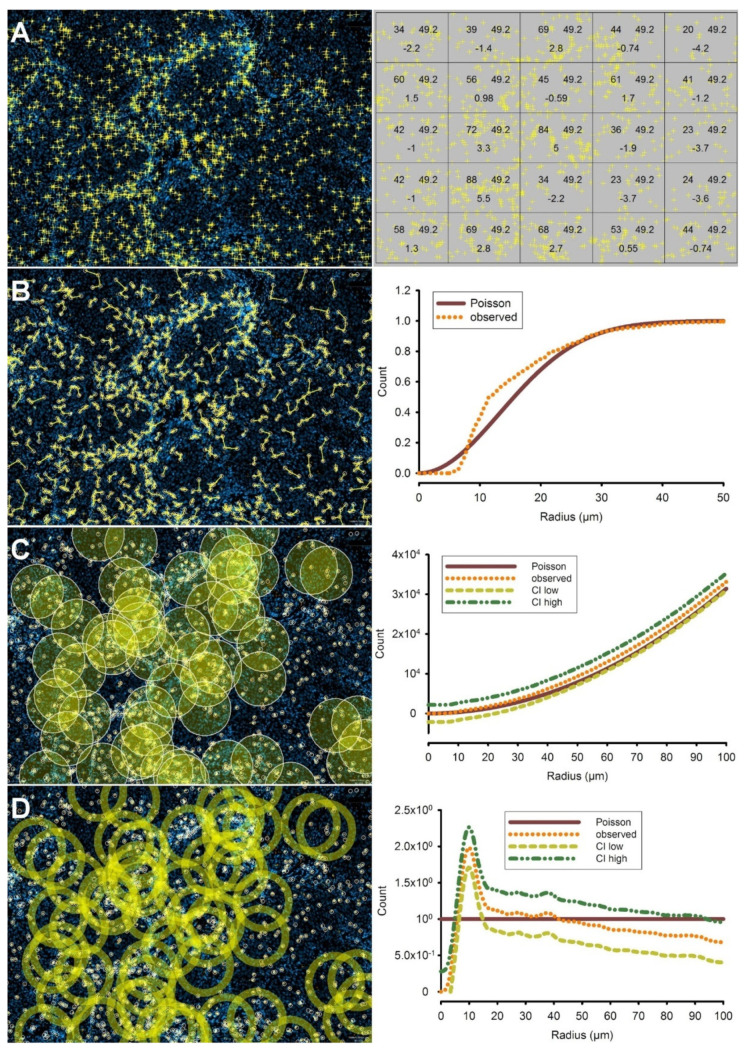
Figure 2.
(A) The most simple method to assess clustering of cells is the quadrat test. Left panel: distribution of CTL (yellow) in the same region of a squamous cell carcinoma of the head and neck depicted in Figure 1. Clustering is less evident visually when CTL are viewed separately, outside of the context of tumor and stroma areas. First, the quadrat test (right panel) shows statistically significant inhomogeneity (p < 2.2 × 10⁻¹⁶). The numbers within the quadrats (from left to right) represent the number of events in each quadrat, the average number in all quadrats, and the residuals. (B) The G-function is another method to assess the clustering of CTL. Left panel: Graph of nearest neighbor distances of CTL (yellow lines), depicted as an overlay on the same tumor area. Right panel: a plot of the G-function (for any given CTL) shows a higher probability of the presence of the nearest neighboring CTL within a distance of approximately 8–23 µm than would be expected in a random distribution. The low values in the distances leading up to 8 µm are a result of the technical shrinkage of cells with a certain diameter to points for the sake of the calculation. (C) For the K-function, the average number of neighboring cell events within a circle of a given radius r is calculated for each cell event in the population. Left panel: representative circles of r = 50 µm are shown. This process is repeated for every value of r up to 100 µm in the region of interest (ROI). K-functions are standardized, and corrections for edge effects are performed, the details of which have been explained before. The heterogeneity of cell event numbers within these circles is evident. Right panel: a plot of the K-function (orange), corrected for inhomogeneity with its corresponding 95%-confidence band (green and yellow lines). Although an upward deviation from the Poisson distribution (complete spatial randomness (CSR), brown line) is evident, this did not leave the 95% confidence bands. Hence, the deviation from CSR in this example using the K-function is not statistically significant (D). The pair correlation function (pcf) of the same dataset shows pronounced clustering at low distances. Left panel: contrary to the K-function, the pcf analyzes the number of cells on expanding rings, thereby scanning through layers around each individual CTL. Right panel: Contrary to the K-function, the pcf shows significant clustering in a band between 7 and 15 µm around the cell, whereas no deviation from CSR is evident at distances beyond.

