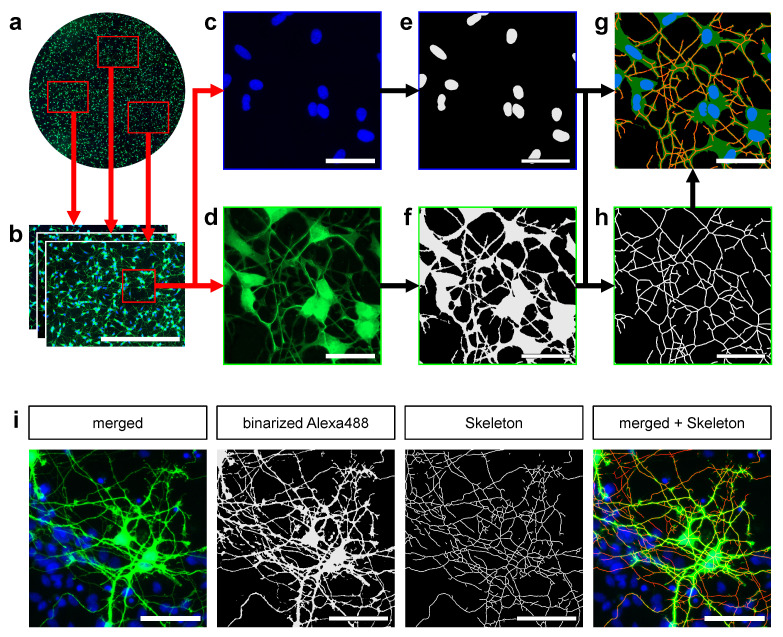
Figure 1.
Fully automated skeletonization of neurite outgrowth. (a) Shows a representative image of a coverslip (not to scale) from which three images (b) (scale bar µm) are added to the image data set. Each analyzed image spans px (representing ). For better visualization a representative section is shown in the following (c,d). Scale bars µm. For analysis of neurite outgrowth and morpholgy Alexa 488 channel (c) and DAPI channel (d) are seperated. (e) shows the processed DAPI channel image as a binary image. In (f) the processed Alexa 488 channel is depicted, showing the neurite and soma area as a binary image. The Alexa 488 channel image is skeletonized. The full skeleton without soma substraction is shown in (h). For better visualization the skeleton was morphologically dilated. For visual evaluation the skeleton with soma substraction, the binarized Alexa 488 and DAPI channel image combined into one image (g). Representative images of MDN as they were used in the validation of the presented approach are shown in (i). First, the input image is depicted with a merged Alexa 488 and DAPI channel image. For both Alexa 488 images the binarized image and afterwards produced skeleton are shown. For better visualization the skeleton was morphologically dilated. By combining the final skeleton and the input image the effectiveness of the skeletonization can be evaluated.

