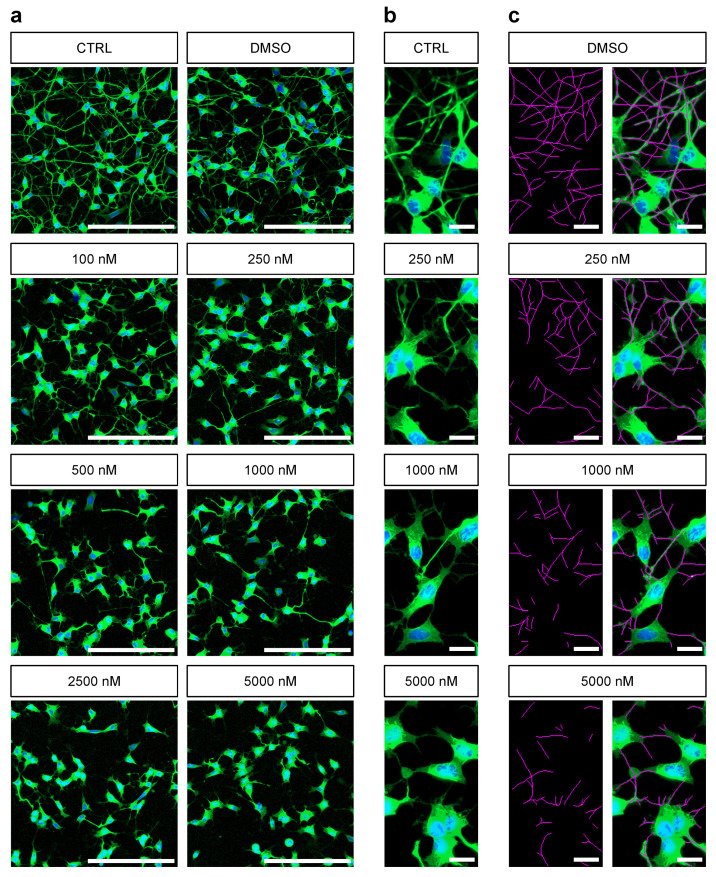
Figure 2.
Dose-dependet effect of different Rotenone concentrations (100 nM, 250 nM, 500 nM, 1000 nM, 2500 nM and 5000 nM) on differentiated SH-SY5Y cells: (a) Representative micrographs of differentiated SH-SY5Y cells 24 h after treatment with Rotenone and control conditions. Stained against Neurofilament (green). Cell nuclei were stained with DAPI (blue). Scale bar µm. (b) Cell morphology of differentiated SH-SY5Y cells in higher magnification. Stained against Neurofilament (green). Cell nuclei were stained with DAPI (blue). Scale bar µm. (c) Exemplary annotation of neurite outgrowth performed manually with the ImageJ-Plug-In NeuronJ. Scale bar µm.

