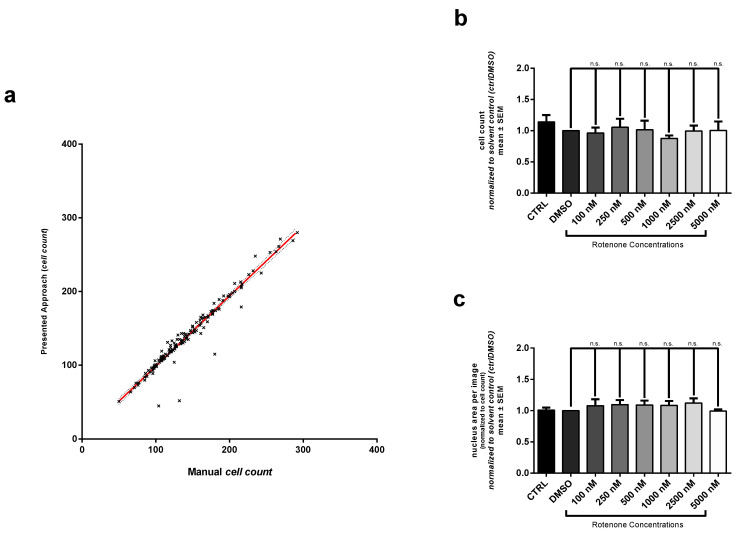
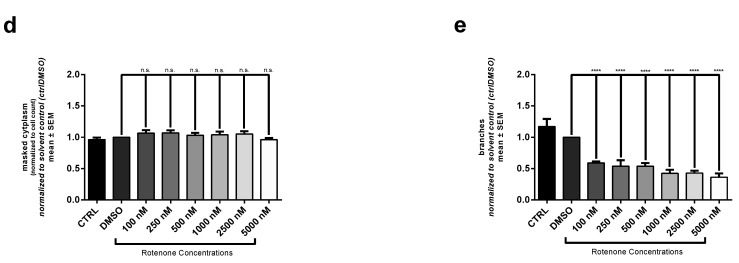
Figure 4.
Additional morphological endpoints analyzed by our approach. (a) Linear regression performed on results automated and manual cell count. (; ) The following endpoints were quantified: (b) cell number, (c) nucleus area, (d) cell body area and (e) neurite arborization. For interpretation results from quantification of cell number and neurite arborization were normalized to solvent control (DMSO). Values of nucleus and cell body area were first normalized to cell count and afterwards normalized to solvent control (DMSO). Data are shown as mean ± SM. * Significantly different () between mean of solvent control (DMSO) and mean of according Rotenone treatment condition. Respectively ** with , *** with and **** with .


