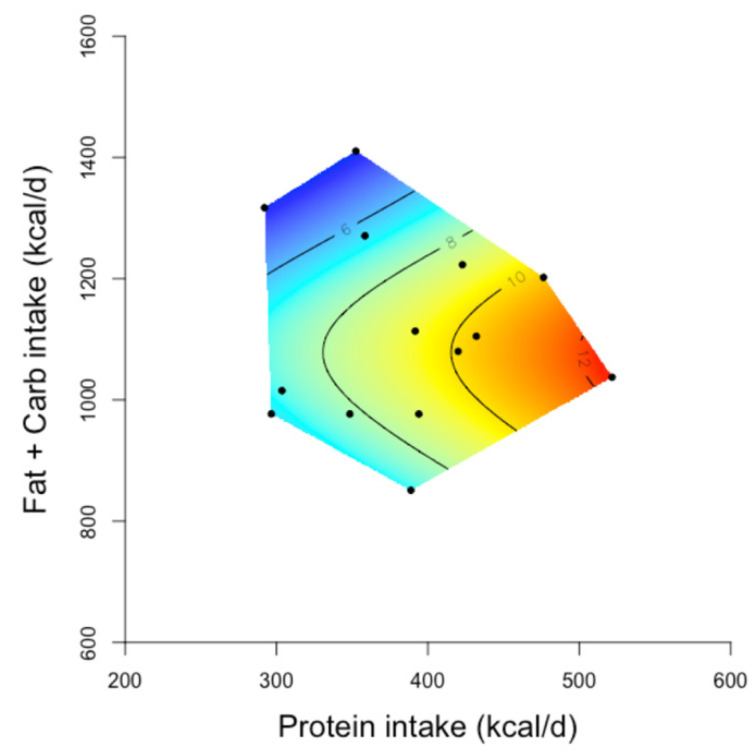
Figure 5.
The relationship between protein and non-protein (fat and carbohydrate intake) and decrease in body weight from baseline on carbohydrate restricted/ketogenic diets [167] (Reprinted with permission from ref [167]. Copyright 2021 Wali, J.A). Two-dimensional geometric framework (GF) surfaces showing the relationship between the intake of energy from protein and non-protein (fat and carbohydrate) sources and the decline in body weight (kg) in study participants. In the GF surfaces, red colour shows the maximum and blue colour shows the minimum decrease in body weight, and black dots represents the intake of protein and non-protein energy reported in each study. Human studies of 2.5–6 months duration which reported the average daily intake of macronutrients of the study participants on carbohydrate-restricted diets and their mean decrease in body weight (n = 14 studies) achieved on these diets (vs. baseline measurements) were included in these GF plots. The decrease in body weight became greater as the protein intake increased (red areas of the surface). Adapted with permission of the authors Wali et al. 2020 [167].

