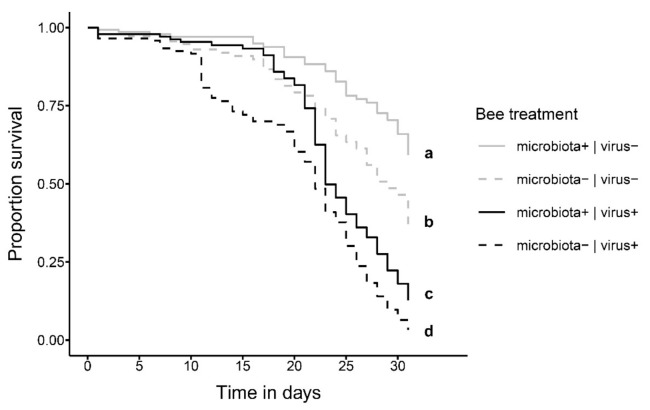
Figure 2.
Survival of bees shown as Kaplan–Meier estimates over the course of the experiment (31 days) that were either fed a bee hindgut homogenate to establish the gut microbiota (microbiota+, solid lines) or not (microbiota−, dashed lines) at day 1 of adult emergence and were then either fed a DWV-B virus inoculum (virus+, black lines) or not (virus−, gray lines) at day 6 of the experiment. Small letters indicate statistically significant differences at α = 0.05 in a Cox mixed-effects model.

